Technical Analysis
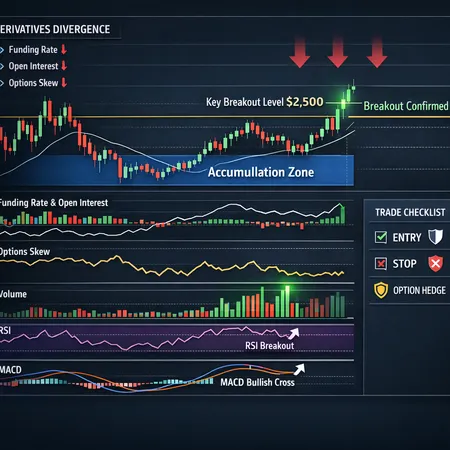
A technical and derivatives-driven look at whether ETH is finishing a multi-year accumulation and what would confirm a sustainable breakout — including key levels, divergence signals vs ETF pressure, macro liquidity catalysts, and a trader's checklist with hedges.
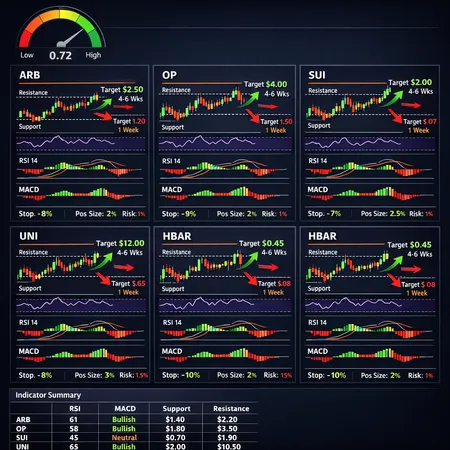
A data-driven technical roundup of ARB, OP, SUI, UNI and HBAR that synthesizes RSI, MACD and key support/resistance to give 1-week and 4–6-week scenario targets plus concrete risk-management rules for momentum and mean-reversion trades.

A data-driven look at Shiba Inu’s latest on-chain adoption from Shibarium admins, the technical signs pointing to a potential trend reversal, and practical trade setups with meme-coin risk management.
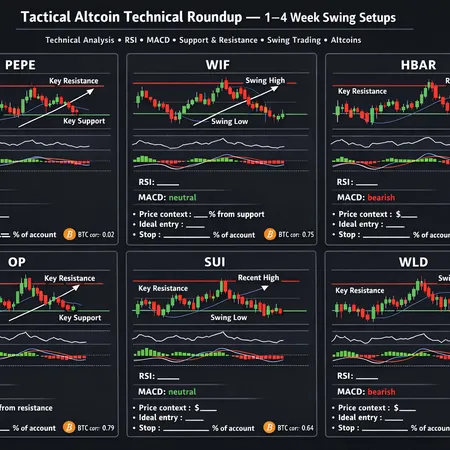
A tactical, trade-focused technical roundup of PEPE, WIF (DogWifHat), HBAR, OP, SUI, and WLD using RSI/MACD and support/resistance to generate 1–4 week swing setups, risk rules, and stop/position-sizing guidance for intermediate traders.

A convergence of macro stressors, renewed whale selling and a fragile technical structure keeps BTC vulnerable in the near term. This article breaks down the triggers, scenarios and a pragmatic playbook for bullish, neutral and bearish traders.
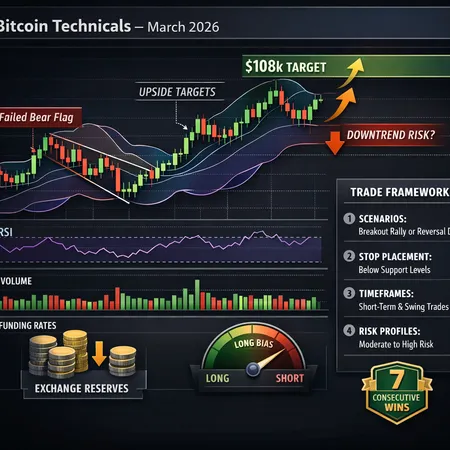
Mid‑March 2026 presents contradictory Bitcoin signals — a bear‑flag rejection versus Bollinger‑Band squeeze and multi‑day wins. This guide synthesizes those inputs into scenario-based trade rules, stop placement, timeframes and how to weight on‑chain data vs technicals.
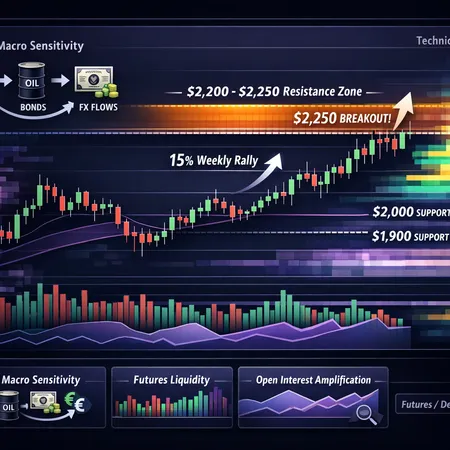
Ethereum has shown growing sensitivity to macro and futures liquidity, and a 15–20% weekly rebound pushed price back into the $2,200–$2,250 zone. This article decodes the on-chain and futures signals traders should watch and offers trade-ready setups for momentum and mean-reversion strategies.
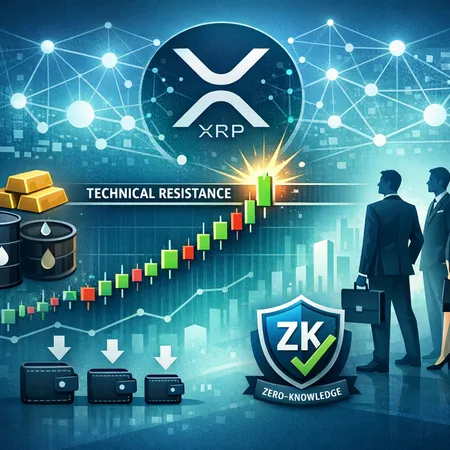
XRP's March 2026 breakout — driven by higher-lows into a major resistance — has reopened conversations about XRPL's institutional rails, tokenized commodities growth, and proposed zero-knowledge privacy upgrades. This article unpacks the technicals, catalysts, protocol developments, and practical trade/positioning implications.
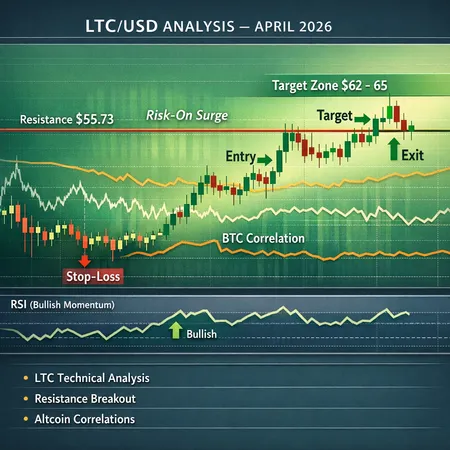
Analysts are eyeing a short-term Litecoin surge to $62–65 in April 2026 after a resistance breakout thesis around $55.73 supported by momentum and a broad crypto risk-on surge. This article lays out the key LTC technical analysis levels, RSI context, entry/exit triggers, stop placement, and correlation scenarios with BTC and institutional flows.

Solana’s recent milestone — surpassing Ethereum and Tron in monthly stablecoin transaction volume — underscores growing on‑chain demand but coincides with mixed derivatives and ETF flows. Traders should weigh stronger retail activity against technical liquidity clusters and sell walls when sizing short‑term SOL trades.
DeFi
All DeFi postsBitcoin
All Bitcoin postsSecurity
All Security posts- Solana Risk Assessment After the Drift $285M Exploit: Price Damage, Supports, and Actionable Trading & Validator Controls
- Preparing for the Quantum Era: Post-Quantum Security for Stablecoin Rails — Arc & Naoris Case Studies
- Inside the April 1 Drift Protocol Hack: Reconstruction, North Korea Links, and a DeFi Security Playbook