ETF Outflows, Self-Custody Losses and the New Stress Test for Bitcoin Markets
Summary
Executive summary
US-listed spot Bitcoin ETFs have recently shown notable weekly outflows that put meaningful downward pressure on the BTC market. Those outflows — when combined with still-large ETF AUM and concentrated institutional holdings — can transmit liquidation pressure through OTC desks and exchanges and leave self-custody holders sitting on substantially larger unrealized losses. This note breaks down the mechanics, explains why a slide below $70k changes market structure and liquidity, and offers practical hedging and execution playbooks for institutional allocators and intermediate traders.
What the recent ETF numbers actually say
Last week, US-listed spot Bitcoin ETFs recorded a net outflow in the order of hundreds of millions of dollars. Cointelegraph reported a weekly outflow figure of about $133 million, and framed it in the context of an extended streak of negative sentiment and ETF withdrawals. That number by itself isn't catastrophic for a market that routinely handles billions, but it's the pace and persistence of outflows that matters for short-term liquidity and dealer balance sheets (Cointelegraph).
Put differently: averages can mask clustering. A single $133M outflow in a calm market is manageable; repeated weeks of that magnitude force market makers and custodians to sell more aggressively, widening spreads and increasing slippage for large blocks.
Historical context
Spot ETF flows have swung from large inflows in prior quarters to the current outflow regime. Historically, flows have acted as a multi-billion-dollar faucet or drain; the key is the directional persistence of flows. Persistent outflows compact liquidity at market-relevant price levels and create larger price impact for the same nominal size.
How ETF redemptions link to unrealized losses in self-custody wallets
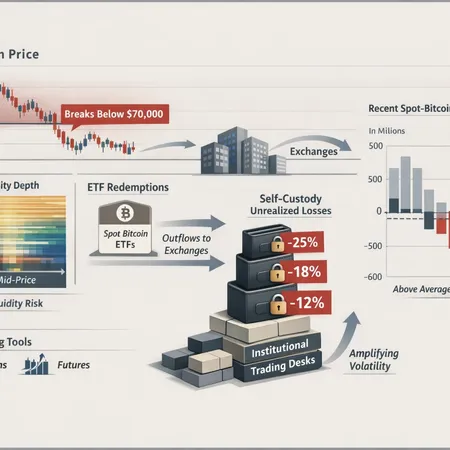
There is an intuitive chain: ETF investors redeem, ETF managers need to provide cash or transfer BTC to satisfy redemptions, custodians and authorized participants either sell on the open market or coordinate OTC transfers, and that increases spot selling pressure. When selling pressure moves price lower, holders outside the ETF — particularly self-custody wallets that do not actively hedge — see their paper gains evaporate.
Recent analysis connected ETF capital flight to a dramatic rise in unrealized losses held by self-custody wallets: Cryptopotato reported that ETFs shedding roughly $8.5B coincided with about $27.8B in unrealized losses among Bitcoin self-custody holders. That gap reflects amplified markdowns: institutional sell decisions move price first, and private holders absorb the downstream markdown without the same liquidity management tools (CryptoPotato).
This matters for two reasons:
- Behavioral spillovers. When retail and private holders see large unrealized losses, they may sell into weakness, creating a second wave of selling.
- Liquidity mismatch. Self-custody holders are often long-dated, illiquid participants — they don’t provide the bid when price gaps; they simply markdown the value of their holdings.
Why BTC slipping below $70k matters for liquidity and market structure
The $70k mark is more than a round number; it's a confluence point for liquidity, options strikes, and derivative positioning. A sustained slip below that level changes how market participants stack bids and hedges.
- Visible order-book depth thins. Many institutional bidders and algorithmic liquidity providers program thresholds: remove passive bids when volatility or adverse selection rises. A break below $70k has historically led to shallower resting liquidity and wider spreads.
- Derivatives dynamics shift. Options gamma exposure and futures funding profiles concentrate around major strikes. As BTC falls through strikes clustered near $70k, market makers needing to hedge can accelerate buying or selling in the spot to remain delta-neutral, which amplifies intraday moves.
- Margin and financing stress. Leveraged traders and structured products may face margin calls when mark-to-market losses exceed buffers; that often forces rapid deleveraging into a thin market.
- Psychology and stop clustering. Many stops and retail stop-losses are placed around round numbers. When stops cluster, a single liquidity hole can cascade as stops feed into market orders.
NewsBTC pointed out that ETFs still hold billions even as BTC slips below $70k, which creates an odd duality: large institutional inventory remains while immediate liquidity to absorb forced selling is constrained (NewsBTC). That concentration — lots of passive assets sitting in funds while the market lacks active natural buyers — is a recipe for volatile price paths.
Institutional positioning and how it can amplify volatility
Institutional positioning matters both on balance-sheet and behavioral fronts.
- ETF AUM concentration. Large ETF holdings mean a few institutional flows can represent a meaningful share of intraday volume. Authorized participants and custodians that manage creation/redemption can become dominant flow originators during stress.
- Concentrated custodial holdings. When custodians hold large chunks of exchange-tradable supply, their operational decisions (e.g., routing to OTC desks vs. spot markets) set the demo for how price will move.
- Leverage in derivatives. Hedge funds and prop desks frequently use futures to express views. When ETF-driven selling moves spot rapidly, futures open interest and funding swings can trigger forced deleveraging in both directions.
In short: positioning creates whipsaws. Even large passive ETFs can be a volatility amplifier when flows flip from inflows to outflows, because the liquidation pathway routes through the same liquidity pools that retail and OTC desks rely on.
Practical takeaways: hedging and liquidity management for allocators and traders
Below are actionable rules and trade tools to manage ETF-driven price risk. These are framed for institutional allocators and intermediate traders who need operational and tactical guidance.
For portfolio managers (strategic and tactical)
- Liquidity-adjusted sizing. Size allocs not just by target exposure but by realized liquidity — how big a trade you can execute within X basis points without moving the market. Reduce size when ETF outflows persist.
- Staged execution frameworks. Use TWAP/VWAP for large rebalances and pre-arranged block trades with liquidity providers. Pre-negotiated OTC fills reduce market impact.
- Use collars for downside protection. Buy puts and sell calls (a collar) to cap downside while financing some cost; useful when you intend to remain long but want protection against a fast slide.
- Stress-test portfolios with ETF-flow scenarios. Model the effect of several consecutive weeks of outflows (e.g., $100–300M/week) and estimate slippage, funding costs, and margin impacts.
For active traders (execution and hedging)
- Short dated futures to hedge spot exposure. Futures are liquid and can be used to hedge intra-day or multi-day exposures quickly. Be mindful of basis and roll costs.
- Put spreads and long-put calendars. If outright puts are costly, use bear put spreads to cap downside cost or calendar puts to protect near-term gamma risk.
- Delta-hedged option selling with careful gamma management. Selling premium can work in range markets, but when ETF flows flip, you can get run over. Limit gamma exposure and size carefully.
- Dynamic sizing and liquidity-aware take-profit/stop rules. Widen stops in thin markets and consider time-based exits (e.g., exit if liquidity vanishes for X hours) rather than price-only rules.
Execution & counterpart strategy
- Pre-arranged blocks and crossing networks. When available, use block trades or crossing networks to move large size. They remove the trade from the open order book and reduce signaling risk.
- Build multiple counterpart lines. Don’t rely on a single OTC desk; diversify prime brokers and liquidity providers so a single dealer’s balance-sheet stress doesn’t block execution.
- Watch basis between ETFs and spot. Sometimes ETF share price diverges from NAV during stress; arbitrage desks and allocators can exploit or suffer from this — treat basis as a liquidity risk metric.
Monitoring checklist: metrics that give early warning
Trackable indicators give you lead time to adjust exposures:
- Net daily ETF flows and AUM changes. Momentum in flows is as important as headline AUM.
- Exchange BTC reserves. Rising exchange reserves often correlate with selling intent.
- Funding rates and futures open interest. Sudden spikes in OI with skewed funding can signal crowded positions.
- Option skew and put-call ratios. A rapid rise in skew suggests growing demand for protection.
- On-chain transfers from custodial addresses. Large movements from custodians to exchanges often precede selling.
- Order-book depth at key price levels (e.g., $70k). Monitor resting bids size and the slope of the book around round-number support.
Scenario playbooks (quick reference)
- Mild stress (single-week outflow, < $200M): Use tactical futures hedges and staggered VWAP execution for rebalances. Maintain normal sizing but widen actionable stop levels.
- Moderate stress (multi-week outflow, $200M–$1B cumulative): Implement collars on long exposure, increase OTC block usage, negotiate committed liquidity lines with counterparties. Reduce new long initiations.
- Severe stress (several weeks of heavy outflows, ETFs materially shrinking AUM): Consider temporary reduction in long exposure, use long-dated puts for portfolio protection, and apply liquidity haircuts to VaR and concentration limits.
Execution caveats and costs
Hedging and liquidity management have real costs: option premia, basis decay in futures, and slippage on large trades. Avoid false comfort from small-sample hedges. The goal is not to eliminate risk — that's impossible — but to manage it at an acceptable cost and to limit permanent impairment from forced exits.
Final thoughts
ETF flows are a structural feature of today’s Bitcoin market: they provide access and scale, but they also create a route for large, coordinated redemptions to pressure spot liquidity. The recent weekly outflows and the associated spike in unrealized losses among self-custody holders illustrate how institutional flows can cascade into the retail and private-holder universe. For allocators and active traders the appropriate response is operational: plan execution, broaden counterparties, and use delta and option hedges to buy time rather than trying to time the bottom.
Platforms and services across the ecosystem — from OTC desks to P2P and installment providers — will matter to how this stress plays out; for instance, solutions like Bitlet.app sit in the broader landscape of execution and access tools that allocators may consider when balancing liquidity and convenience.
Monitor flows, protect downside with staged tools, and keep a constant line to your liquidity providers; when ETF sentiment flips, the market can move faster than models anticipate.
Sources
- Weekly ETF outflows and historical streak context — Cointelegraph
- ETF capital flight linked to $27.8B unrealized losses in self-custody — CryptoPotato
- Price action and ETFs still holding billions as BTC slips below $70k — NewsBTC
For additional reading on market microstructure and liquidity, see related coverage on Bitcoin and macro on DeFi.