On-Chain

A deep read of recent XRP derivatives spikes, Ripple’s 25M on‑chain transfers and shrinking exchange reserves suggests institutional accumulation beneath muted spot action. We connect Ichimoku cues, custody dynamics and XRPL’s quantum-resilience narrative to frame entry and custody considerations for allocators.

The Covenant AI subnet exit triggered a fast, public governance crisis for Bittensor's TAO token, exposing design gaps in decentralized AI protocols. This investigation traces the events, analyzes technical failures, and offers pragmatic guardrails for DAOs and protocol designers.
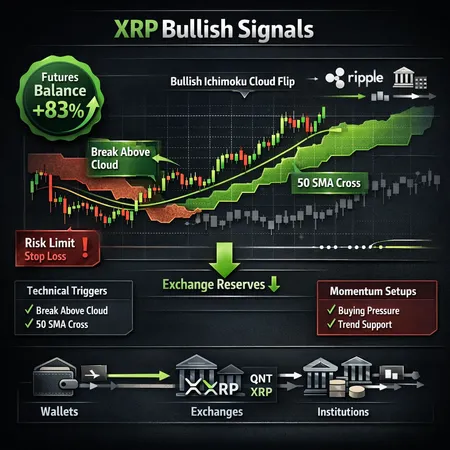
A deep-dive into four under-the-radar bullish signals for XRP — an 83% futures-balance spike, an Ichimoku cloud flip, falling exchange reserves and growing institutional activity — and how traders can turn them into concrete setups.
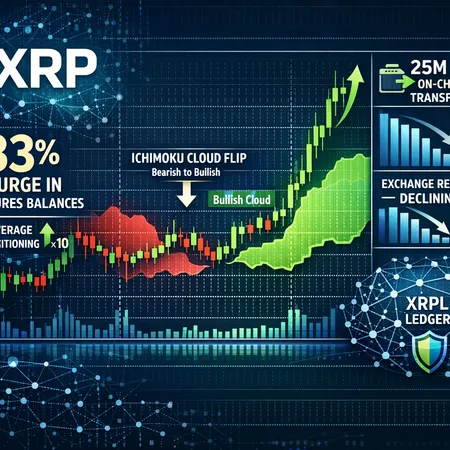
A synthesis of derivatives data, Ichimoku technicals, large on‑chain transfers, falling exchange reserves and XRPL security to assess whether XRP is setup for a sustainable breakout.
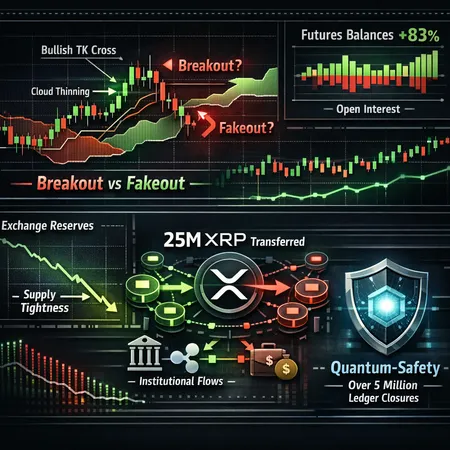
An 83% jump in reported XRP futures balances and falling exchange reserves point to latent bullish pressure beneath a calm spot market. Combine that with large on‑chain transfers and an Ichimoku bullish flip — and traders must weigh breakout scenarios against classic derivative‑led fakeouts.

Weekend surges in meme tokens often look similar on the surface but have very different underpinnings. This feature breaks down $TRUMP, DOGE and SHIB rallies and selloffs — and gives a practical framework for separating fleeting social pumps from durable on-chain recoveries.
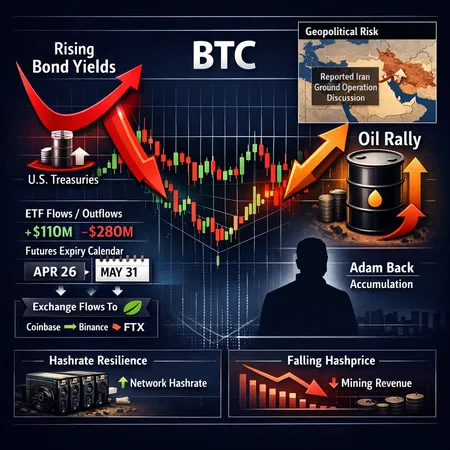
This deep dive explains how rising U.S. bond yields, an oil rally and fresh Middle East headlines are combining with ETF flows and on‑chain signals to compress BTC price action. It also lays out the on‑chain confirmations and a clear trade/portfolio checklist for risk‑off scenarios.

Shibarium transactions have spiked more than 1,500%, yet SHIB’s price is stuck in limbo. The surge looks driven by automated/upgrades and large exchange inflows — a mix that raises both opportunity and risk for retail holders.
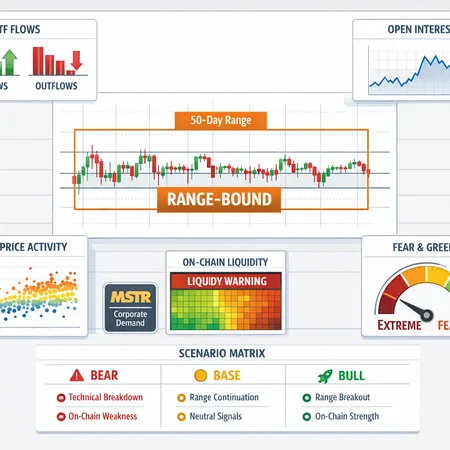
A 50-day tight range in BTC is more consistent with structural consolidation than a classic bear-flag unwind. This article reconciles on-chain signals (ETF flows, open interest, STH activity), Glassnode liquidity warnings, and extreme market sentiment into a practical bear/base/bull scenario matrix for traders.

A data-driven look at Shiba Inu’s latest on-chain adoption from Shibarium admins, the technical signs pointing to a potential trend reversal, and practical trade setups with meme-coin risk management.