Bitcoin: Price Compression, Mixed Signals, and the Practical Roadmap for Traders
Summary
Executive snapshot
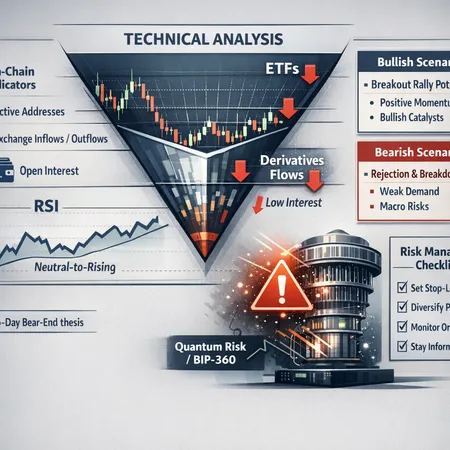
A classic volatility contraction is unfolding in BTC: price compression into a triangle or funnel, RSI fatigue across timeframes, and a market that’s trading on finely balanced flows rather than clear directional conviction. Technical charts hint at an explosive move once range-bound energy resolves; yet on-chain signals, derivatives metrics and ETF flows are sending mixed — sometimes weak — demand cues. Add a rising conversation about non-price risks (quantum-computing vulnerability and protocol hardening proposals) and the picture becomes richer — and more cautious — for intermediate traders and allocators.
For many traders, Bitcoin remains the primary bellwether for crypto allocations, but the near-term roadmap requires synthesizing technical analysis, on-chain indicators, derivatives/ETF flows, and protocol-level risks. Below I lay out the technical template, reconcile it with empirical flow data and expert timelines, discuss the implications of quantum risk chatter, and finish with actionable scenario planning and risk-management rules you can apply to positions in BTC.
The technical setup: triangle/funnel compression and what RSI is telling us
Price has been gradually tightening into a recognizable triangle — a classic consolidation pattern where higher lows meet lower highs in a narrowing range. Technical analysts often call this a funnel or symmetrical triangle: volatility compresses, liquidity clusters at the edges, and the eventual breakout tends to be fast and decisive. A recent technical note described this exact setup, highlighting a price compression that typically precedes an "explosive move" when volume and momentum return to the tape (CryptoDaily analysis).
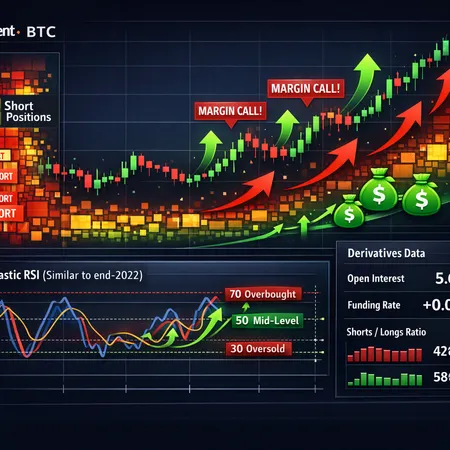
RSI is especially instructive here. Across multiple timeframes the Relative Strength Index has been rangebound with no decisive bullish divergence; on shorter timeframes it has cycled between neutral and mildly oversold, but has not sustained the readings that typically accompany a reliable breakout. That matters: when RSI refuses to confirm price strength, breakouts can fail or lead to fakeouts that trap momentum traders. For intermediate traders, it’s useful to watch RSI on the daily and 4-hour charts concurrently — the daily for directional bias and the 4-hour for breakout confirmation and re-entry timing.
Technically, two high-probability plays emerge: 1) a breakout with volume confirmation followed by a retest of the broken trendline as support/resistance flip; or 2) a breakdown that accelerates once the base of the triangle is violated, often accompanied by a spike in open interest liquidation on leverage-heavy exchanges. Because the range is tight, stop placement needs to account for intrarange whipsaw — wide enough to avoid noise but tight enough to cap losses.
On-chain, derivatives and ETF flow context: the demand story is mixed
Price patterns don’t exist in a vacuum. On-chain indicators (exchange flows, realized volatility, active addresses) and institutional signals (ETF inflows/outflows, derivatives open interest and funding rates) help qualify the conviction behind any breakout. Recently, coverage showed Bitcoin trading under pressure near the mid-to-high $60ks with derivatives metrics and ETF flows pointing to weaker demand than price action alone might suggest (Coindesk).
What to watch specifically:
- Exchange balances: A sustained increase in exchange reserves can signal selling pressure; conversely, continued withdrawals to cold custody reduce available liquidity and can exacerbate upside moves.
- ETF flows and custody flows: Retail and institutional ETFs remain a major demand channel for BTC; weekly inflows or outflows often set the tone for multi-week trends. Weak or volatile ETF demand softens the bullish case, especially when price is compressing.
- Derivatives structure: Funding rates near zero or negative, coupled with elevated open interest, can indicate short-term positioning imbalances. If a breakout occurs without a prior flush of leveraged longs, the move might lack the fuel of a short squeeze and thus be more fragile.
In short, the market is compressed and the demand signals are not uniformly bullish, meaning breakouts will need validating by both volume and supporting flow data.
Expert timeline: bear cycle end in under 365 days — plausibility check
Some market participants are willing to put a near-term horizon on the bear cycle. Notably, Altcoin Sherpa has projected that the Bitcoin bear market could end in less than 365 days — a view covered in trading commentary and summarized in trade-media coverage (NewsBTC recap).
How to reconcile that with technical and flow data? It’s plausible under a few conditions: resilient macro liquidity (e.g., a dovish pivot in rates), a renewed bout of ETF inflows that overwhelm transient selling, or a technical breakout that triggers a feedback loop of FOMO and momentum buying. But the timeline is vulnerable to opposite pressures: persistent weak ETF demand, regulatory shocks, or a disproportionate supply unlock.
For allocators, the Altcoin Sherpa thesis is a useful probabilistic anchor — not a certainty. Treat it as one scenario among several, then size exposure and layer entries so that your portfolio can absorb downside if the timeline proves optimistic.
Non-price risk: quantum computing talk and protocol hardening proposals
Risk is not only about price. Recently public figures and investors have highlighted long-term threats from quantum computing to ECDSA and related signature schemes used by Bitcoin. Kevin O'Leary has publicly flagged quantum risk as a consideration for BTC's outlook and discussed protocol-level proposals aimed at hardening cryptographic primitives (crypto.news coverage).
Proposals such as BIP-360 and concepts like P2MR (Pay-to-Multi-Reservation / or other quantum-resistant address formats — note community nomenclature and drafts vary) are meant to future-proof key management and reduce the attack surface if quantum advances threaten existing elliptic curve signatures. The practical implications are several:
- Governance and upgrade complexity: Any meaningful protocol change requires broad consensus across nodes, miners/validators and wallets — a slow, conservative process for good reason.
- Custody and migration: Custodians will need migration plans if/when a transition is required, and institutional custodians could introduce execution risk during such a window.
- Market perception: Even the rumor of a hardening proposal can create short-term uncertainty as funds reassess custody exposures.
For traders and allocators the immediate risk is low — quantum computing capable of breaking ECDSA is not here today — but the conversation matters because it adds an operational and governance dimension to portfolio risk that is distinct from price volatility.
Scenario planning: what intermediate traders and allocators should prepare for
Create a small set of clearly-articulated scenarios and guardrails. Below are practical rules and tactical setups that map to the compressed market backdrop.
Scenario A — Clean breakout: volume and ETF/derivatives flows confirm
- Signals: Daily close above upper trendline + volume spike + positive ETF inflows + rising funding rates.
- Action: Add in tranches (e.g., 25% increments) on the retest of the broken trendline; tighten trailing stops; consider call spreads to leverage upside with defined risk.
Scenario B — False breakout / quick rejection
- Signals: Price briefly pierces upper trendline but falls back within 48–72 hours; RSI divergence; neutral/negative ETF flows.
- Action: Avoid chasing; use protective options (buy puts, collar strategies) or exit partial positions; reassess thesis only after confirmed range violation.
Scenario C — Breakdown into higher volatility sell-off
- Signals: Daily close below lower triangle boundary + exchange balance spike + negative ETF flows + cascading liquidations.
- Action: Reduce leveraged exposure immediately; deploy staged buys at predetermined liquidity or on-chain thresholds, not at arbitrary bottoms; consider hedges via inverse products or buying longer-dated puts if available.
Portfolio sizing and leverage rules
- Keep leverage modest during compression — the reward/risk is asymmetric and a sudden move can decimate levered positions.
- Use position sizing rules tied to volatility: smaller positions when ATR is tight but a breakout would spike ATR rapidly.
- For allocators: dollar-cost averaging or time-based tranche entries reduce timing risk against an uncertain timeline like the <365-day bear-end thesis.
Operational controls for non-price risks
- Use custodians with documented upgrade/migration plans and multi-sig schemes that can execute emergency patches without single-point failure.
- Follow technical BIPs and working group discussions; if a credible hardening path emerges, stress-test custody and settlement workflows.
Practical monitoring checklist (daily/weekly)
Daily
- Watch RSI on daily and 4-hour; note divergence and extremes.
- Monitor funding rates and open interest on major derivatives venues.
- Track ETF flow reports and large custody movements.
Weekly
- Check exchange reserve trends and realized volatility.
- Review top-line on-chain metrics (active addresses, large transfers) and press for protocol-level updates.
Risk thresholds
- Predefine stop levels relative to the triangle boundaries and ATR.
- Predefine allocation caps (maximum % of liquid net assets in BTC) depending on scenario risk appetite.
Conclusion — synthesis and a pragmatic stance
The current BTC market is a textbook compression: the chart signals an eventual, probably sharp, move, but the conviction behind that move is tempered by mixed on-chain indicators and soft ETF/derivatives flows. An expert timeline like Altcoin Sherpa’s sub-365-day bear-end thesis is plausible under supportive macro/liquidity conditions, but it should be treated as one scenario, not an anchor of certainty. Meanwhile, quantum-risk conversations and protocol hardening proposals introduce a non-price axis of risk that custodians and allocators should not ignore.
For intermediate traders and portfolio managers the path forward is disciplined: trade lower edge risk with tight, well-sized exposures, insist on multi-source confirmation for breakouts (price + volume + flows), and incorporate operational checks for custody and upgrade readiness. Keep an eye on daily technical confirmations and weekly flow metrics — and be ready to adapt if the triangle resolves in either direction.
Bitlet.app users and allocators should integrate these monitoring signals into their execution plans and stress tests as part of a broader risk framework.
Sources
- Altcoin Sherpa projection that the Bitcoin bear market could end within 12 months: https://www.newsbtc.com/bitcoin-news/top-expert-projects-bitcoin-bear-market-to-end-in-less-than-365-days/
- Technical analysis describing BTC price compression into a triangle: https://cryptodaily.co.uk/2026/02/bitcoin-technical-analysis-february-17-price-compression-builds-explosive-move-coming
- Coverage showing Bitcoin under pressure with derivatives metrics and ETF flows pointing to weak demand: https://www.coindesk.com/markets/2026/02/17/bitcoin-remains-under-pressure-near-usd68-000-even-as-panic-ebbs
- Kevin O'Leary on quantum risk and protocol hardening proposals (BIP-360 / P2MR discussion): https://crypto.news/kevin-oleary-points-to-quantum-risk-in-bitcoin-price-outlook/