Five Altcoins With the Best Short‑Term Technical Setups: XLM, NEAR, APT, DOT, ZEC
Summary
Executive summary
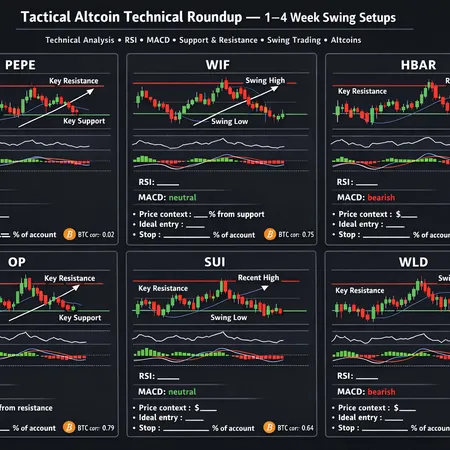
Intermediate traders hunting high‑probability altcoin setups will find five candidates with clean short‑term technical structures: XLM, NEAR, APT, DOT and ZEC. Each has a defined bullish trigger and a sensible reward target (from a few weeks to a couple of months), plus obvious invalidation levels. This article lays out the daily chart picture for each token, suggests entry rules, stop‑loss placement, and position sizing, and explains how to build a balanced portfolio across these signals without over‑concentration.
For context, many traders still use Bitcoin as the macro market barometer; treat these mid‑cap setups as tactical opportunities that work best when BTC is stable or reclaiming key levels. Bitlet.app users will find these rules useful when sizing positions and automating recurring buys.
How I screen these five
The selection here is strictly technical: price structure (higher lows, clear support), momentum readings (RSI approaching neutral/oversold for bounces), and defined breakout/bounce targets from near‑term resistance. Where relevant, I cite recent technical writeups that project specific targets — use those as a published view to compare with your own charts.
Now let’s walk each setup, the bullish trigger, timeframes, and a conservative trade plan.
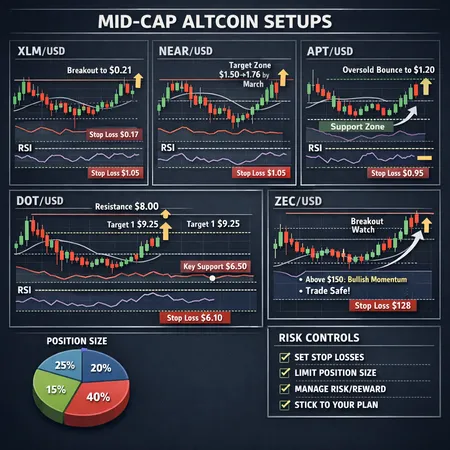
XLM (Stellar): breakout to $0.21
Technical picture (daily): Price is consolidating after a pullback. The short‑term RSI sits around the low‑40s — not oversold but not bullish — while price is testing the 50‑day SMA from below. Immediate support sits near the $0.15 area and clear resistance around $0.19–$0.21.
Bullish scenario & trigger: A decisive daily close above $0.21 would confirm a breakout and open a run toward $0.27–$0.30 in a best‑case short‑term scenario. Alternatively, a clean retest of $0.15 that holds with improving RSI and rising 21/50‑day SMAs would set up a lower‑risk long. The technical prediction that highlights the $0.21 breakout/ $0.15 pullback trade is summarized in recent coverage — see the note on the possible $0.21 breakout for context.
Trade plan & risk controls: Entry can be either a breakout entry above $0.21 with a stop just below $0.19 (tight intraday invalidation) or a pullback entry at $0.155–$0.16 with a stop under $0.14 for a higher reward/risk. Target 1 = $0.27, Target 2 (stretch) = $0.30. Risk per trade: 1–2% of portfolio equity, using position sizing to convert stop distance into notional size.
NEAR Protocol: recovery toward $1.50–$1.76 by March
Technical picture (daily): NEAR recently traded in oversold ranges; daily RSI has shown readings under 35 during the sell‑off, and price is below the 50‑day SMA while testing longer‑term support (weekly structure). The pattern reads like a mean‑reversion candidate with a clear down‑side invalidation under structural support.
Bullish scenario & trigger: A close above the 21/50‑day SMA cluster or a reclaim of $1.10–$1.20 (depending on current level) would signal that sellers are exhausted. Published technical commentary projects a recovery target range of about $1.50–$1.76 into March — a reasonable short‑term objective if macro conditions cooperate and RSI recovers into neutral territory. See the NEAR recovery analysis for the projected target range.
Trade plan & risk controls: Consider scaling in if price holds above the identified structural support and RSI climbs back above 45. Initial stop: 15–20% below entry (or under the weekly structure low). Target 1 = $1.50, Target 2 = $1.76 (timeframe: several weeks to early March). Keep single‑trade risk 1% of capital; because NEAR is volatile, prefer smaller position sizes than for more liquid mids.
Aptos (APT): oversold bounce to ~$1.20
Technical picture (daily): APT has been flagged as oversold in recent technical reviews, with strong momentum divergence on some timeframes and short‑term RSI below 30 at extremes. Price sits below both the 21 and 50‑day SMAs but may find support at a multi‑week demand zone.
Bullish scenario & trigger: A clean momentum divergence (price testing a low with RSI higher than its prior low) or a daily close back above the 21‑day SMA would be a tactical long trigger. Published analysis suggests a potential bounce toward roughly $1.20 in the coming weeks if oversold conditions resolve — a classic snapback play from deeply oversold levels; see the APT oversold coverage.
Trade plan & risk controls: Because oversold bounces can fail, use two approaches: (A) short, aggressive scalp with stop tight (10–15%) for traders who enter after a first sign of momentum; (B) staged entries (50% initial, 50% add on a confirmed close above the 21‑day SMA). Stop under the recent swing low. Reward targets: $0.90–$1.20 depending on entry; hold timeframe: a few days to several weeks. Limit APT exposure to no more than 3% of portfolio equity per trade given higher volatility.
Polkadot (DOT): short‑term and medium‑term targets, critical support
Technical picture (daily/weekly): DOT shows a layered structure: short‑term range, medium‑term downtrend that is testing a critical support band. RSI is neutral to slightly oversold on the daily, while the 50‑day sits below the 200‑day (bearish bias) on weekly timeframes.
Bullish scenario & trigger: A reclaim of the $1.50 area (as noted in technical coverage) or a sustained daily close above the 50‑day SMA would change the near‑term trend and open a move toward $2.00+ in a more optimistic case. Conversely, failing to hold the critical support band would invalidate bullish setups and signal further downside.
Trade plan & risk controls: Enter on a confirmed daily close above the 50‑day SMA or on a pullback that respects the critical support band with bullish divergence on RSI. Place stops under the support band (15–25% depending on entry). Target 1 = $1.50 (flip to support), Target 2 = $2.00 (medium term). Because DOT can be whippy, prefer smaller allocations and staggered scaling: e.g., 60% initial, 40% add on confirmation.
Zcash (ZEC): breakout implications and a potential larger rally
Technical picture (daily): ZEC recently put in a breakout from a base; momentum measures like RSI have turned positive and the 21/50‑day SMAs are beginning to slope up. Break above prior resistance has shifted risk/reward favorably to the long side.
Bullish scenario & trigger: A confirmed breakout that holds on a retest implies buyers are in control and opens room for a multi‑leg rally. Recent coverage argues the breakout could trigger a 30–40% rally if momentum sustains — a scenario consistent with historical post‑breakout behavior for midsized privacy coins. See the ZEC breakout analysis for the thesis behind a larger rally.
Trade plan & risk controls: Enter on breakout with a stop just below the breakout pivot or the retest low. Alternatively, if you missed the initial leg, wait for a retest and confirmation (bullish engulfing day or RSI support at 50). Target 1 = prior measured move (roughly +25–35%), Target 2 = stretch (40%+). ZEC is cyclical; keep single‑trade risk to 1–2% of equity and avoid adding into clear trend exhaustion.
Trade management: position sizing, stops and timeframes
- Position sizing: Risk a fixed percentage of portfolio equity per trade (commonly 1% max for a single signal; aggressive traders may use 2%). Convert that dollar risk into position size using entry price and stop distance. Example: with $100,000 equity and 1% risk ($1,000) and a 20% stop distance on a $1.00 token, position size = $5,000 (5,000 tokens).
- Stop placement: Use technical invalidation levels (swing lows, pivot flips, below structural support). Avoid arbitrary percentage stops without relation to chart structure.
- Scaling: For volatile altcoins, prefer staging entries: 50–60% initial, add the remainder on confirmation. This helps manage false breakouts.
- Timeframes: These are short to mid‑term plays — expect setups to resolve in days to 8–12 weeks. Mark your calendar for re‑evaluations (e.g., weekly check‑ins) and trim if momentum fades.
Portfolio construction and exposure control
- Risk parity: Use equal risk per trade, not equal capital. This keeps high‑volatility tokens from dominating the portfolio.
- Max exposure: Cap aggregate exposure to these five altcoins at 10–15% of total portfolio equity unless you have a higher conviction and a hedging plan. Within that cap, limit any single token to 3–4% of equity.
- Diversification across setups: Combine at least two non‑correlated setups (e.g., a breakout like ZEC and a mean‑reversion like APT) to smooth returns.
- Rebalancing: If one position runs big (hit target), take partial profits and rebalance back to target risk levels. Use trailing stops for winners to lock gains while leaving room for continuation.
Practical checklist before entering
- Confirm macro bias (BTC direction, liquidity). If BTC is collapsing, tighten stops or stand aside.
- Verify the trigger (breakout close, reclaim of SMA, or momentum divergence).
- Compute position size using defined stop and risk% rule.
- Place stop and two targets (take partial profit at Target 1, trail remainder).
- Monitor weekly and adjust stops as structure changes.
A quick reminder: these technical setups are short‑term and require active management. If you prefer passive exposure, convert these ideas into small, periodic buys rather than concentrated tactical trades.
Final notes and caution
Technical setups are probability plays, not guarantees. Use the described invalidation points: if they trigger, exit and reassess. Keep position sizing disciplined and avoid concentration — mid‑cap altcoins can gap and behave unpredictably. For traders using on‑chain or order‑flow tools, add those filters for further edge; for everyone else, a disciplined chart‑driven approach and stop placement is the simplest risk control.
Also, while headlines and technical writeups help form a view, double‑check live charts at entry time — conditions change rapidly.
Sources
- Price prediction: XLM — Stellar eyes $0.21 breakout or pullback to $0.15
- Price prediction: NEAR — targets $1.50 recovery by March 2026
- Price prediction: Aptos — oversold conditions signal potential recovery to $1.20
- Price prediction: DOT — short and medium‑term targets and critical support
- Zcash breakout and potential rally coverage