ETF Flows

XRP shows a striking divergence: bullish institutional ETF flows and whale accumulation on one side, a weak spot price and volatile short squeezes on the other. This piece explains the market structure behind that split, technical targets, and practical trade frameworks for event-driven traders.
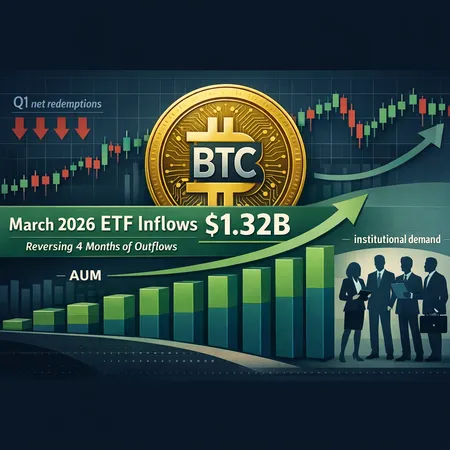
U.S. spot Bitcoin ETFs posted $1.32B of net inflows in March 2026 — the first monthly gain since October 2025 — a development that reshapes how portfolio managers should think about AUM resilience, supply dynamics, and near-term volatility.
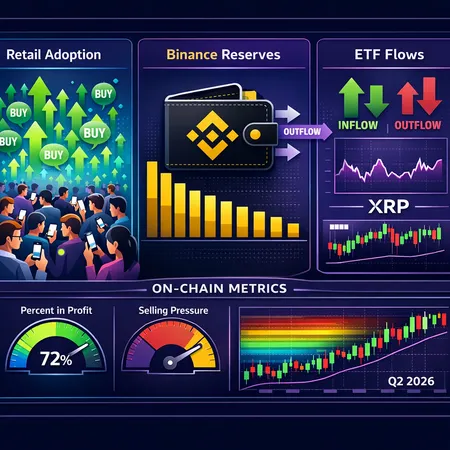
XRP is showing bifurcated signals: clear retail-led activity and falling Binance reserves, while ETF flows provide a more ambiguous institutional picture. This feature analyzes on-chain metrics, liquidity implications, and practical playbooks for retail and institutional allocators ahead of Q2 2026.
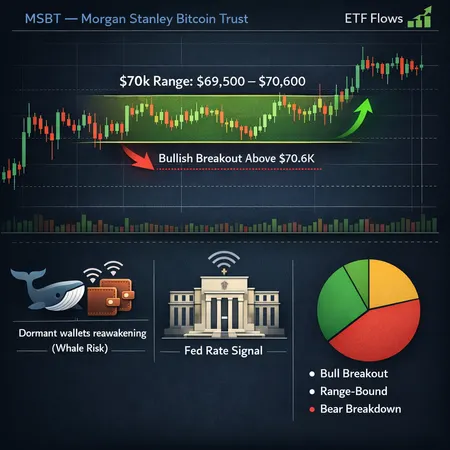
Bitcoin is consolidating in a tight $69.5k–$70.6k range as the MSBT ETF narrative gains traction — a decisive breakout or breakdown could rapidly redraw orderflow. This piece maps technical triggers, the implications of Morgan Stanley’s S‑1 and demand estimates, macro and whale risks, and scenario-based allocations for active traders.
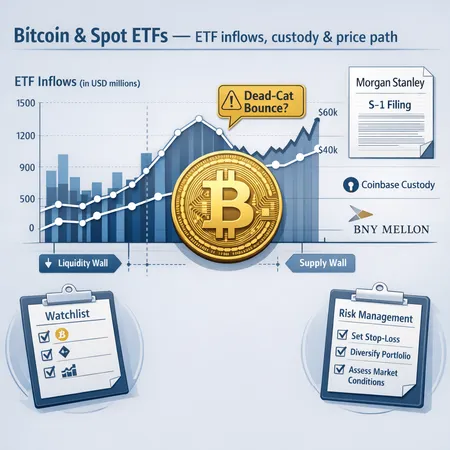
Recent spot‑ETF inflows—led by BlackRock’s IBIT—and high‑profile institutional filings are reshaping structural demand for BTC. This guide unpacks the data, custody implications from Morgan Stanley’s S‑1, counterarguments that this is a dead‑cat bounce, and a practical watchlist and risk checklist for positioning.
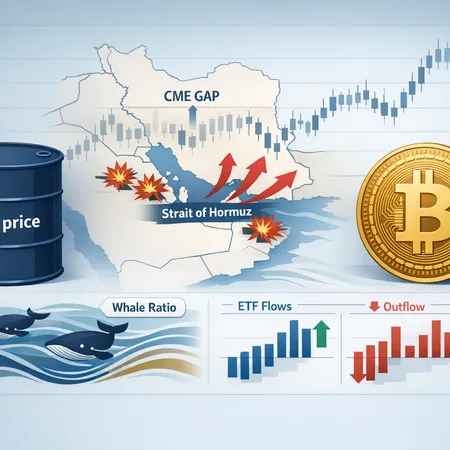
The US–Israel strikes on Iran have reignited Strait of Hormuz and oil-price risk, transmitting through liquidity channels into crypto — explaining why Bitcoin has been both volatile and resilient. This article breaks down the mechanics, on-chain and institutional signals, and 1–3 month scenarios traders and allocators should plan for.

Renewed US spot ETF inflows have pushed BTC back toward $68–70K, yet thin spot volumes and a large options expiry create a fragile backdrop. Traders should weigh ETF flows against liquidity metrics and derivatives risk to plan hedges or tactical trades.

Solana‑linked ETFs have shown steadier inflows this month even as BTC and ETH ETF demand cooled, revealing structural reasons tied to application activity, perceived yield and liquidity dynamics. This analysis unpacks flow data, price effects on SOL, index‑tracking risks and lessons for the next wave of altcoin ETFs.
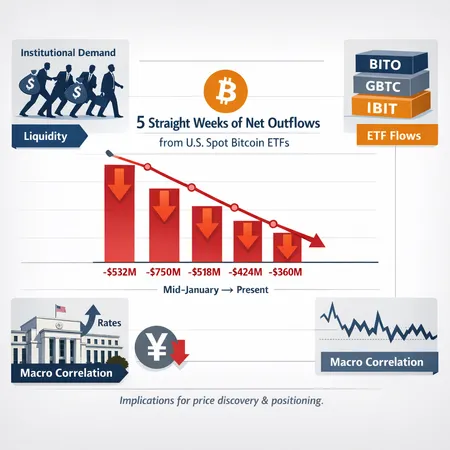
Five consecutive weeks of net outflows from US spot Bitcoin ETFs mark a shift in liquidity dynamics that matters for price discovery, volatility, and macro correlation. This piece unpacks the timeline, who's withdrawing, how flows interact with macro drivers, and practical positioning for traders and long‑term investors.
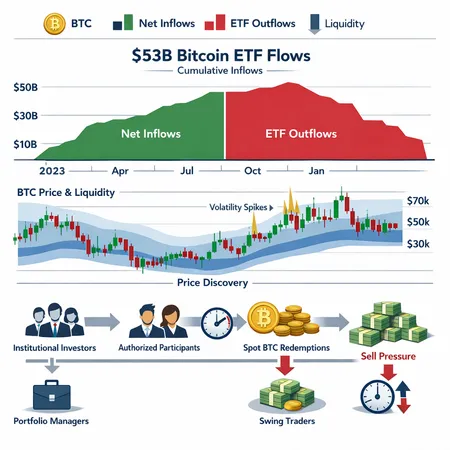
U.S. spot Bitcoin ETFs show roughly $53B in cumulative net inflows even as funds experienced meaningful short‑term outflows. This article explains the chronology, ETF mechanics, and practical sizing rules for portfolio managers and swing traders navigating ETF‑driven liquidity events.
DeFi
All DeFi postsBitcoin
All Bitcoin postsSecurity
All Security posts- Solana Risk Assessment After the Drift $285M Exploit: Price Damage, Supports, and Actionable Trading & Validator Controls
- Preparing for the Quantum Era: Post-Quantum Security for Stablecoin Rails — Arc & Naoris Case Studies
- Inside the April 1 Drift Protocol Hack: Reconstruction, North Korea Links, and a DeFi Security Playbook