XRP Price Mechanics: U.S. Trading Hours, ETF Flows, and Technical Resistance Playbook
Summary
Executive summary
XRP’s short-term price action is now being shaped by three interlocking forces: concentrated flows during U.S. trading hours, incremental XRP exposure tied to broader ETF demand, and immediate technical resistance clusters that decide whether intraday momentum becomes a sustained move. The net effect is that liquidity pulses—often during New York hours—are producing rapid, tradable ramps and reversals. Traders who read orderflow, use session VWAPs, and respect relative liquidity (including how BNB is sucking capital away) will have an edge.
For context, Bitlet.app traders have increasingly watched U.S. session volume as a leading trade trigger; the mechanics below are actionable whether you scalp or run multi-day swing positions.
Why U.S. trading hours matter for XRP flows
Several recent market notes point to outsized buying into XRP concentrated in U.S. exchange hours. That pattern isn’t unique to XRP—large-cap crypto often shows a bias toward U.S. liquidity windows—but for XRP the effect has been pronounced enough to look like a recurring "stampede." CoinPaper documented this dynamic, attributing a chunk of recent strength to aggressive buying during U.S. hours (CoinPaper report).
Mechanics to understand:
- Concentrated dollar liquidity: U.S. hours aggregate a large pool of fiat- and institutional-sized orders; when those orders skew buy-side, price gaps can form quickly.
- Execution algorithms and ETFs (or ETF-like allocation flows) often operate on GMT−5/−4 schedules, increasing the chance of clustered entries.
- Intraday VWAP and FVG (fair value gap) levels during the U.S. session become short-term magnet zones. If U.S.-hour buyers are heavy, the opening two hours can create momentum that traps sellers into short squeezes.
For an active trader, the practical takeaway is simple: monitor volume and orderbook dynamics around the New York session open and close—and expect larger-than-normal directional moves then.
How ETF-related flows add XRP exposure (directly and indirectly)
Media coverage in recent weeks highlights that ETF flows across crypto markets have been unusually large, and institutional positioning tied to spot ETFs and ETF-like products is reshaping liquidity distribution. U.Today reported a surge in ETF-related flows across multiple crypto assets, noting institutional rebalancing that can bleed into altcoins and XRP-linked vehicles (U.Today coverage).
A few nuanced ways ETFs and institutional products affect XRP:
- Direct ETF vehicles for XRP remain limited in most jurisdictions; however, ETF flows for major benchmarks (and multi-asset products) lead desks and allocators to rotate capital into liquid alternatives such as XRP when seeking yield or spread capture.
- Derivative desks may delta-hedge baskets or structured products, which creates spot-side buying or selling pressure on XRP even if the headline ETF exposure is to Bitcoin or Ether.
- Prime brokers and large market-makers respond to rebalancing by shifting inventory across correlated pairs; that redistributes liquidity and can amplify U.S.-hour moves.
So while not every ETF headline implies a direct buy order for XRP, the net growth of ETF demand in crypto increases baseline liquidity and the probability of one-sided intraday consumption of available bids or offers.
Competing liquidity: BNB’s return to prominence and why it matters for XRP
Market-cap rotations matter. Crypto.news recently covered how BNB reclaimed a higher market-cap slot, pulling liquidity and attention into BNB markets and away from some altcoins including XRP (Crypto.News analysis). When BNB or another large-cap token re-accelerates, several second-order effects appear:
- Risk capital reallocation: Traders and algo funds re-weight books toward the stronger flow, which reduces the depth of resting orders in tokens like XRP. Lower depth = easier to move price on less volume.
- Cross-market stop clusters: Fast moves in BNB can trigger correlated liquidations that either exacerbate or negate XRP moves depending on direction and leverage cross-exposures.
- False-breakout risk: A liquidity vacuum can make intraday breakouts look clean but be unsustainable once the competing asset reclaims attention.
For an XRP trader this means you must watch relative-volume and net-flow into BNB vs. XRP during the U.S. session. If BNB is trending up with heavy volume, expect fewer big sustained XRP breakouts unless ETF-linked flows explicitly target XRP.
Technical resistance and the levels that decide the near term
Rather than giving single-price prophecies, this section offers a hierarchy of technical tools and a method to convert them into concrete levels on your chart:
Session VWAPs and daily volume profile: Use the U.S. session VWAP as an intraday bias line. A sustained trade above the session VWAP with volume confirms buyer control; failure to hold the VWAP signals short-term exhaustion.
Multi-timeframe EMA/MA clusters: Watch the 1H/4H 20–50 EMA ribbon and the daily 200 MA. These moving averages often act as resistance clusters. If price is approaching a confluence of the 4H 50 EMA and a prior weekly high, expect a tougher clearance attempt.
Liquidity heatmaps and visible orderbook walls: Identify where large resting orders are concentrated—those are technical resistance/support before price can move through.
Fibonacci clusters and swing structure: Draw 0.382–0.618 retracements from the most recent impulse. These retracement bands frequently coincide with orderflow resistance.
How to convert this to tradable levels:
- Intraday resistance: the U.S. session high + the session VWAP + any visible wall within ~1–2% of the high. That 1–2% band is where intraday stop-hunts and liquidity sweeps happen.
- Near-term resistance (multi-day): confluence of the 4H EMA cluster, a weekly high, and a 0.5 retrace—expect higher slippage and false breakouts here.
Use ATR (14) to define stop distances: a 1.2–1.5x ATR stop for intraday scalps; 2–3x ATR for swing entries.
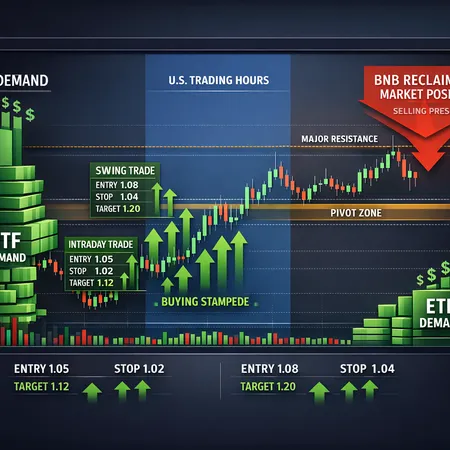
Trade setups: intraday and swing playbook
Below are practical setups that reflect the interplay of U.S. trading hours, ETF demand, and technical resistance. Each setup lists entry, stop, target, and rationale.
Intraday — U.S. session momentum scalp
- Timeframe: 5–15m chart for execution, 1H–4H to set bias.
- Trigger: Price breaks above the U.S. session VWAP with at least 30% higher volume than the trailing 30-min average and a tightening spread in the orderbook.
- Entry: On a retest of VWAP or a micro-FVG fill (limit entry) or aggressive market entry on breakout.
- Stop: 1.2x ATR below entry or below the VWAP (whichever is wider).
- Target: First visible liquidity band (session high or orderbook wall) — typically 0.5–1.5x your risk.
- Rationale: Large U.S. orders often create short squeezes in the opening hours; capturing that momentum with tight risk management is high-probability.
Intraday — Fade a one-sided U.S.-hour spike
- Timeframe: 5–30m.
- Trigger: A quick 3–6% ramp inside two hours of U.S. open with RSI > 75 and volume skewed to taker-buys but failing to push through a proximate resistance cluster.
- Entry: Short on a rejection candle or structural failure beneath session VWAP.
- Stop: 1.5–2x ATR above the spike high.
- Target: VWAP or the next visible support cluster.
- Rationale: Rapid, concentrated flows often leave thin liquidity above; when smart money sells into the pop, price reverts to VWAP.
Swing — ETF-flow continuation trade
- Timeframe: 4H–Daily.
- Trigger: Sustained delta-positive flows during multiple U.S. sessions accompanied by rising funding rates and a breakout above a weekly resistance cluster (with follow-through volume).
- Entry: On a daily close above the resistance cluster or a 4H pullback to the breakout level.
- Stop: 2–3x ATR below the breakout level or under the weekly structure low.
- Target: Use measured moves from the breakout base or Fibonacci extensions; scale out in tiers (25/50/25%).
- Rationale: If ETF-driven rebalancing is persistent, breakouts that start in the U.S. session can become multi-day trends.
Swing — Risk-off (BNB-driven) reallocation fade
- Timeframe: Daily/4H.
- Trigger: Clear market-cap rotation where BNB is outperforming and spot flows favor BNB over XRP for several U.S. sessions.
- Entry: Short on failure to reclaim a critical MA cluster or on breakdown below weekly structure.
- Stop: 3x ATR above a recent swing high.
- Target: Prior demand zone or a defined percentage move consistent with your risk profile.
- Rationale: Competing liquidity means XRP can underperform and sell off faster than market breadth suggests.
Market scenarios and triggers to watch
Bull scenario (confirmation): Multiple consecutive U.S. sessions with volume-confirmed buying, daily close above weekly resistance cluster, and stable or improving relative strength versus BNB. Trigger to add: follow-through on day 3 with increasing open interest on derivatives desks.
Bear scenario (confirmation): Failed U.S.-hour breakouts, shrinking depth as BNB outperforms, and daily close below a major weekly support—plus funding rates collapsing. Trigger to add short exposure: a decisive daily close below the last weekly demand zone.
Neutral / chop: Repeated spikes and reverts around session VWAP, low net directional conviction, and large ETF headlines that fail to move the tape. Trade smaller size or sit out until a directional edge returns.
Risk management and execution notes
- Size to liquidity: Reduce trade size when book depth is thin; use limit entries near confluence zones.
- Monitor correlated flows: Watch large-cap ETF flows and BNB moves; a sudden rotation can flip your thesis quickly.
- News and schedule risk: Major ETF filings, regulatory headlines, or macro prints during U.S. hours can amplify moves—avoid initiating large swing positions immediately before high-impact events.
- Use Bitlet.app or your chosen platform to stagger buys (e.g., installment or DCA) if you prefer reducing entry timing risk.
Execution checklist (pre-trade)
- Check U.S. session calendar and overlapping liquidity windows.
- Confirm session VWAP and 4H bias (EMA ribbon).
- Inspect orderbook for visible walls and volume heatmap.
- Confirm relative strength vs. BNB and overall crypto ETF flow headlines.
- Set ATR-based stop and scale plan.
Final thoughts
XRP is increasingly reacting to concentrated U.S. liquidity pulses and the broader structural shifts caused by institutional ETF demand. Those flows are real and tradable, but the growing competition for capital—exemplified by a resurgent BNB—means that traders must combine orderflow awareness with classic technical discipline. Intraday scalps should lean into U.S. session momentum and VWAP dynamics; swing traders should wait for volume-confirmed breakout follow-through or rely on disciplined fading tactics when competing liquidity dominates.
Sources
- CoinPaper: U.S. trading hours are driving an XRP buying stampede
- U.Today: XRP, Solana, Ethereum and Bitcoin ETF explode in $1,000,000,000 surge
- Crypto.News: XRP bulls face make-or-break test as BNB grabs fourth place
For context on how major market bellwethers influence altcoin rotation, many traders still watch Bitcoin and capital flows into core markets when sizing XRP trades. For protocol-level liquidity and on-chain interest, comparisons to DeFi metrics can be useful when building a longer-horizon thesis.