Could Macro Wobbles Push Bitcoin Back to $50K? An Evidence-Based Trader’s Plan
Summary
Executive summary
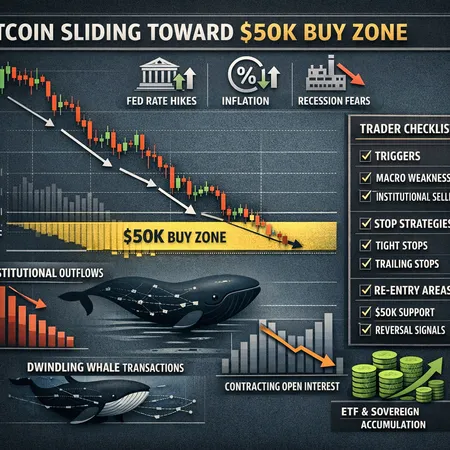
Macro instability combined with weakening buy-side liquidity is a realistic route for Bitcoin (BTC) to fall back toward the $50K area. Over the last few weeks institutional products have seen notable outflows and on‑chain metrics show lower whale activity and thinner liquidity. Technical charts and open interest contraction further widen the path for a deeper retracement unless fresh institutional demand or DeFi-driven flows reappear.
This piece dissects the signals—macro, on‑chain, derivatives and technical—and then lays out a practical checklist for traders and risk managers to execute a scenario plan, with clear triggers, stop strategies and staged re‑entry levels.
Why macro wobble matters more now
Macro conditions are the proximate driver that can flip the market from consolidation to a directional selloff. When risk assets face a sudden liquidity squeeze—rising rates, a surprise central bank move, or shock to credit markets—correlated selling in crypto tends to accelerate because crypto’s marginal buyer is still flow-driven.
Analysts have warned that renewed macro wobbliness could push Bitcoin back into the lower $50K band if risk appetite abruptly tightens. For one view of that argument see this industry analysis that outlines how macro wobbles can erode BTC’s higher range support and flip price momentum lower Macro wobble warning.
Why that matters: in a stressed macro episode, institutional buyers who were waiting on the sidelines often withdraw bids, ETFs see redemptions, and algorithmic market makers widen spreads—together these actions materially reduce the market’s ability to absorb sell orders.
Institutional flows: a large outflow story
The clearest, short‑term bearish datapoint is the magnitude of institutional selling in recent weeks. CoinShares data reported in market coverage shows institutional investors sold roughly $3.74 billion in crypto and Bitcoin products in a single month, a scale of outflow that can overwhelm passive and active bids near current price levels Institutional outflows report.
Practically, those outflows matter because: 1) product providers redeem inventory by selling spot or futures, 2) selling begets volatility which chases liquidity providers away, and 3) concentrated redemptions compress the order book, increasing slippage for large buys. Institutional flows are the clearest on‑chain/market signal that the bid side is weakening at scale.
Whale behavior and on‑chain liquidity
Whales—large BTC holders—are often the marginal liquidity providers for big institutional-sized trades. A sudden change in whale activity thus signals a change in liquidity dynamics.
On this front, recent reporting showed a 72% decline in tracked Bitcoin whale transactions over a two‑week window, a meaningful reduction in the number of large on‑chain transfers that historically correlate with large trades or reorganized allocations Whale transactions down 72%. Fewer whale moves can mean less on‑chain liquidity available to absorb large market orders without slippage.
Couple falling whale transactions with anecdotal signs of open interest contraction in derivatives markets, and the picture becomes clearer: there’s less leverage and less counterparty risk capacity at elevated levels, which can accelerate moves if a liquidity shock occurs.
Technicals and open interest: how charts widen the path lower
From a technical perspective, several chart analysts flagged that failure to hold key supports increases the odds of a lower low. One technical write‑up highlights a fight over the $68K level—with a loss there potentially opening a longer leg down and retest of lower supportive zones Charts flag $68K fight and lower‑low risk.
Open interest contraction in futures markets is a double‑edged signal: it reduces immediate liquidation risk because leverage is lower, but it also means there are fewer counterparties willing to take the other side of a trade. In a selloff, that can magnify price moves since fewer buyers are positioned to step in.
Taken together—weak buy pressure from institutions, decline in whale transactions, and contraction in open interest—the technical path to a deeper retracement becomes credible.
Bullish counterarguments and why the picture is not one‑sided
There are several countervailing narratives that could check or reverse downside momentum.
First, the “buy‑zone” thesis: many long-term investors and some institutional programs view levels well below recent highs as attractive accumulation points. That latent bid can appear quickly if price action is orderly and macro headlines stabilize.
Second, ETF and institutional accumulation remains a live bullish argument. Some institutional investors and sovereign-related entities have used spot ETF wrappers to accumulate exposure steadily, which can create persistent demand over time. Institutional strategies tied to spot ETFs have been cited as a structural bid in recent coverage and institutional commentary—in the same vein, tailwinds from emerging DeFi demand may add incremental flows Bitwise/DeFi view.
Finally, lower whale transaction counts are not identical to selling: they can also indicate whales sitting tight and not moving balances on‑chain, which reduces visible volatility. In short, compressed whale movement could be either a bearish liquidity gap or a bullish sign of holders choosing to HODL—context matters.
A scenario checklist for traders and risk managers
Below is a structured checklist and playbook built for active traders and risk managers who want an evidence‑based approach if the market shifts toward a macro‑driven selloff.
Triggers to watch (entry to a bearish scenario)
- Macro shock: a surprise central bank communication, faster‑than‑expected rate moves, or a major credit market event that ripples into risk assets. Monitor rate headlines and USD liquidity metrics.
- Institutional flow acceleration: consecutive days of large ETF/redemption outflows or negative net flows reported by product providers (watch CoinShares and product flow data). A fresh wave of redemptions increases downside risk.
- Whales resume outbound transfers: after the recent 72% decline, renewed high frequency of whale transactions is an early sign that large holders are moving to sell whale transactions decline report.
- Derivatives signal: sudden spike in put buying, or a rapid increase in open interest on the sell side after contraction—this can presage forced deleveraging.
- Technical breach: a decisive close below key supports (e.g., break and daily close below $68K in some scenarios) with volume confirmation charts warning.
Stop strategies and risk sizing
- Use position sizing tied to realized volatility: scale down exposure if realized vol doubles week‑over‑week. Smaller positions reduce liquidation and slippage risk when book depth thins.
- Hard stop levels: for directional trades use percentage stops or technical stops just above/below logical invalidation points (e.g., if shorting a breakdown below $68K, place stops above the breakout retest zone). Avoid clustering multiple large stop losses at identical round numbers.
- Use options for asymmetric risk: buying protective puts or using collars can limit downside while allowing participation in rebounds. This is preferable to levered futures if market liquidity is compressed.
- Staged scaling: enter in tranches across several neutral to bearish triggers rather than all‑in on a single signal. This helps manage execution risk in a fast move.
Re‑entry and accumulation areas (staged buy zones)
- First tier: $66K–$68K — if price revisits this area and macro headlines stabilize, expect buyers who view it as a local accumulation band.
- Second tier: $60K–$62K — a more conservative buy zone where long-term institutional programs historically increase cadence of buys.
- Tail bargain zone: ~$50K — in a deep macro‑driven liquidation, $50K becomes the strategic buy zone for many allocators. Plan to scale in here over multiple days to avoid front‑running large sellers.
When re‑entering, monitor on‑chain whale flows and product inflows to validate that orders are being absorbed by real demand rather than short‑covering rallies.
Execution checklist (practical steps)
- Subscribe to real‑time institutional flow and product data feeds—CoinShares and ETF flow trackers are essential early warnings.
- Monitor whale transfer trackers and exchange netflow data; a sudden pickup in outbound transfers is a red flag.
- Watch derivatives open interest and funding rates: spikes in either direction often precede sharper moves.
- If markets breach a technical trigger, scale into protective options and reduce net exposure before adding a directional bias.
- If you’re running a trading desk, set pre‑approved limit orders at the staged buy zones but size them conservatively to minimize price impact.
Balancing probability and preparedness
No single dataset will perfectly predict a selloff. The highest‑probability approach blends macro vigilance with on‑chain monitoring and disciplined risk management. The current constellation—sizeable institutional outflows, a pronounced drop in whale movement, and technical warnings around $68K—creates a credible pathway to the $50K zone if macro conditions deteriorate further. Conversely, persistent ETF accumulation and potential DeFi‑led demand are real moderating forces that can arrest declines.
For active traders and risk managers, think in scenarios rather than certainties: plan for the $50K downside while keeping execution rules ready to lean into the market should institutional bids reappear. Tools like staged buys, option hedges, and strict stop discipline help manage the asymmetric risks in either direction.
Bitlet.app users and traders will want to integrate product flow signals into any re‑entry model, and to keep both macro and on‑chain indicators monitored in real time.
Conclusion
Macro wobble plus thinner buy‑side liquidity can plausibly push BTC back toward the lower $50K range. Recent institutional outflows and a decline in whale transactions are meaningful datapoints that reduce market depth; technicals and open interest dynamics can amplify moves. That said, the market is not without bullish levers—ETF accumulation flows and DeFi demand could reverse momentum if they accelerate.
Traders should prepare a clear checklist of triggers, stop rules and staged re‑entry zones, and execute with disciplined sizing and hedges rather than conviction without contingency plans.
Sources
- https://www.newsbtc.com/bitcoin-news/macro-wobbles-may-send-bitcoin-back-to-the-50000s-industry-ceo-claims/
- https://dailyhodl.com/2026/02/18/institutional-investors-sell-3740000000-in-bitcoin-and-crypto-in-just-one-month-as-btc-price-craters-coinshares/
- https://zycrypto.com/bitcoin-whale-transactions-decline-72-in-the-last-2-weeks-as-sell-off-slows-down/
- https://coinpaper.com/14706/bitcoin-bears-target-lower-low-as-charts-flag-68-k-fight-and-80-k-retest?utm_source=snapi
- https://www.theblock.co/post/390292/bitwise-cio-says-defi-could-lead-market-out-of-crypto-winter-as-strategys-saylor-predicts-bitcoin-recovery
For additional context on market structure and flow monitoring, consider integrating exchange flow feeds and on‑chain analytics into your watchlist. For many traders, Bitcoin remains the primary market bellwether, while emerging liquidity from DeFi protocols could prove the next structural support if institutional buying pauses.