Dogecoin: Weighing TDOG ETF Flows Against a Weekly Falling Wedge Breakout
Summary
Executive snapshot
Dogecoin (DOGE) sits at an awkward crossroads: the charts are hinting at a classic weekly falling wedge that many technicians read as bullish, while the fundamental, flow-driven support from U.S. spot Dogecoin ETFs — most notably the newly launched 21Shares TDOG — is, so far, underwhelming. For intermediate swing traders this means opportunity paired with elevated breakout risk and liquidity concerns. Below I map the likely scenarios and offer a pragmatic checklist for trading around ETF-driven liquidity and chart setups.
Market context: TDOG launch and current ETF flows
The 21Shares TDOG launch drew headlines, but initial activity has been muted. Reporting shows U.S. spot Dogecoin ETF flows have remained weak since TDOG began trading, with no significant inflows to provide a sustained, institutional bid for DOGE. See the reporting on the TDOG launch and inflow picture for the early read on demand here.
Why this matters: spot ETF inflows translate to actual buying pressure in the underlying asset via creation mechanisms or secondary-market demand. When flows are meaningful, ETFs can materially amplify price moves; when they’re absent, a technically valid breakout can stall for lack of follow-through. Correlation dynamics also matter — for many traders, Bitcoin ETF flows and BTC momentum remain the primary market bellwether that can either drag or lift altcoins like DOGE.
Technical picture: the weekly falling wedge on DOGE
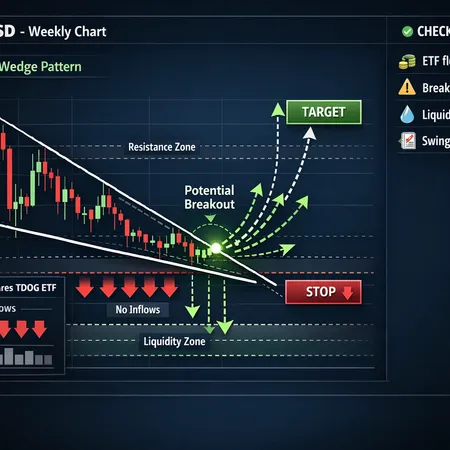
Several analysts have pointed out a weekly falling wedge forming on DOGE. The wedge is characterized by converging trendlines on lower highs and lower lows, typically signaling that bearish momentum is diminishing and a directional flip may be imminent if price breaks the upper trendline with conviction. A clear description and take on the wedge — including potential target geometry — is summarized in independent technical coverage here: falling wedge analysis.
Key technical details traders should watch:
- Weekly close above the upper wedge trendline (confirmation) rather than intraday tag.
- Volume expansion on the breakout candle — higher than the preceding weeks — to suggest real participation.
- Pullback behavior: a clean retest of the trendline that holds becomes an ideal re-entry for swing traders.
Important caveat: falling wedges have favorable odds but are not guarantees. Without accompanying liquidity (see ETF flows), follow-through can be weak and reverse into a failed breakout.
How ETF flows can mute or amplify a technical breakout
Think of ETF flows as the macro-sized fuel tank that can either feed a technical ignition or leave it sputtering. There are three practical scenarios:
Amplified breakout: meaningful net inflows into TDOG and other DOGE products coincide with a weekly wedge breakout. This creates sustained buy pressure, improves liquidity, and increases the chance for a run to measured targets.
Muted breakout: weak or flat ETF flows (the current scenario) mean the breakout relies mostly on retail, derivatives, and spot exchange liquidity. That can produce a short-lived thrust, higher slippage, and the risk of immediate mean-reversion.
Liquidity-driven false break: outflows or arbitrage selling by authorized participants after an initial pop can quickly erase gains and produce whipsaw; this is classic breakout risk when institutional support is absent.
Mechanics matter: spot ETF creations require purchasing the underlying (or using authorized participants to do so), which increases real buy-side demand. The current reporting on TDOG suggests that pipeline is thin, so any DOGE rally might need to be self-supported by spot and derivatives order flow rather than by a steady institutional bid.
Risk management and liquidity considerations for swing traders
When technicals look constructive but flows are weak, risk management must tighten. Practical rules to consider:
- Position sizing: reduce position size relative to a normal breakout thesis (e.g., 50–70% of your typical size) to account for higher failing-breakout probability.
- Stop placement: prefer ATR-based stops or structure stops below a confirmed weekly close retest rather than tight intraday stops. On weekly breakouts, give the trade room but cap risk per trade to a predefined percent of equity.
- Trade confirmation: wait for a weekly close above the wedge plus volume expansion, OR a decisive daily close above a shorter-term resistance with follow-through the next session.
- Slippage & order type: use limit orders or limit-on-close where possible; market orders can suffer in thin liquidity. For larger swings consider working orders across venues to minimize slippage — this is where P2P and OTC liquidity on platforms such as Bitlet.app can be useful for larger fills without moving the market.
Liquidity considerations specific to DOGE:
- During a breakout, spot order books on smaller exchanges can evaporate quickly; check depth on major venues and aggregated liquidity metrics.
- Options markets (where available) can reveal skew and institutional lean; heavy put buying or sudden gamma hedging events can complicate breakouts.
Practical checklist: combining ETF flow data with chart setups
Use this checklist before committing capital:
- Flow confirmation: has TDOG (and other DOGE-focused products) shown sustained net inflows over X trading days? If not, downgrade conviction.
- Weekly close: did the weekly candle close above the wedge’s upper trendline? No weekly close — no confirmed breakout.
- Volume filter: is breakout accompanied by above-average volume across spot venues? Look at multi-exchange volume aggregation.
- Liquidity depth: is there sufficient order book depth to support your size at reasonable slippage? Test small fills if uncertain.
- Correlation check: are BTC and other large-cap alt flows/momentum supportive or neutral? A BTC selloff can erase a DOGE breakout quickly.
- Contingency plan: predefined stop-loss, target, and re-entry rules if the breakout fails (e.g., fade pullback only after a clean retest).
Following this checklist helps you marry ETF flows (the fundamental liquidity picture) with falling wedge setups (the technical trigger), reducing guesswork.
Trade examples and timing windows
Example A — Aggressive breakout play:
- Entry: buy on a daily close above a short-term resistance that follows a confirmed weekly close above the wedge.
- Size: 50–70% normal due to weak ETF flows.
- Stop: below the weekly retest low or 1.5–2x ATR from entry.
- Target: measured move from wedge height, scaled exits on major resistances.
- Add-on rule: only add if 3–5 days of net positive ETF inflows appear or spot volume expands materially.
Example B — Conservative retest play:
- Entry: wait for a weekly close above the wedge and then a clean retest of the trendline holding on reduced volume.
- Size: full normal allocation once retest holds and shallow ETF inflows appear.
- Stop: below the retest low.
Example C — Fade the weak breakout (higher-risk):
- If price spikes above the wedge on low volume and ETF flows are flat/negative, consider a short with tight stops and small size. This is high-probability but high-stress due to potential squeezes.
Timing windows: the weekly wedge implies multi-week patience. Expect meaningful resolution within several weekly bars; don't treat this as a purely intraday event. Watch for macro dates (major BTC/crypto events, CPI prints, ETF reporting windows) that can provide catalysts or kill momentum.
Final thoughts
A weekly falling wedge on DOGE is an attractive technical setup, but with TDOG and U.S. spot Dogecoin ETF flows showing limited early demand, you can't assume institutional fuel will be there to carry a breakout. Combine the chart signal with observable flow data, volume confirmation, and robust liquidity checks. Use smaller sizes, wider, ATR-aware stops on weekly breakouts, and prefer entries after retests unless you can tolerate higher breakout risk.
For intermediate traders this means patience and discipline: the chart can get you into the theater, but ETF flows and liquidity determine whether the play has a second act.
Sources
- Report on TDOG launch and ETF flows: U.S. spot Dogecoin ETF activity remains weak even after 21Shares TDOG launch
- Technical analysis on the falling wedge: Dogecoin wedge breakout could be powerful, analyst says