Chainlink's 21‑Week Slide: On‑Chain Breakdown, Key Support Zones and 3 Trading Setups
Summary
Executive summary
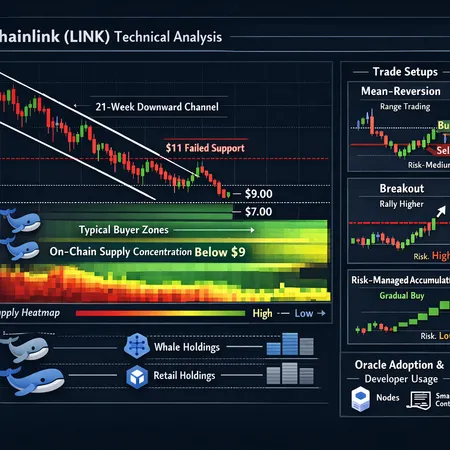
Chainlink (LINK) has endured a multi-month correction that looks structural on price charts and revealing on-chain. The immediate technical problem is clear: a 21‑week slide that failed to hold the $11 zone and recently saw price slip under $9, opening a lower supply band where selling has clustered. On-chain snapshots and exchange flow data show supply building just beneath the surface, with larger holders playing an outsized role in recent distribution. Below I unpack the price action, on‑chain context, what support levels matter, the implications for the oracle narrative and developer adoption, and three practical trading setups tailored to different time horizons.
The 21‑week slide: price context and what broke first
After a prolonged period of consolidation, LINK entered an extended downtrend that the market has now counted at about 21 weeks. That decline wasn't a single panic day but a sequence of lower highs, periodic capitulations, and failed reclaim attempts in the $11–$14 area. The most important technical failure was the inability to defend $11 as a multi-week pivot; once that gave way, momentum favored sellers and liquidity below $9 became attractive to aggressive participants.
This move didn’t happen in isolation. Broad altcoin weakness fed the pressure: during the BTC‑led sell-offs, many alts including LINK experienced amplified declines as capital rotated to safety or simply fled risk assets. For broader context on how altcoins were hit during the same period, see the market overview that catalogues which tokens took the worst hits during Bitcoin's local lows here.
On‑chain supply and holder concentration beneath $9
Two linked on‑chain themes matter now: supply building and concentration of holdings.
Supply building beneath the surface: Recent on‑chain analyses point to accumulation of sellable supply below the current price bands rather than a uniform distribution of coins across price levels. That dynamic means there are latent sellers in the $6–$9 range who will likely defend realized losses or liquidate into rallies. Coinpedia summarized this as supply building “beneath the surface” and identified critical zones for LINK that traders should respect when mapping support and resistance here.
Holder concentration and whale behaviour: When larger addresses accumulate or distribute, price impact is magnified. On‑chain flows and exchange balances suggest that several large holders increased activity during the down leg; that typically looks like concentrated sell pressure into rallies and reduced willingness to buy back quickly. AmbCrypto highlighted the significance of the recent drop below $9 as a signal that short‑term bullish conviction weakened materially here.
Together, these patterns create an environment where bounces can be shallow and rallies face stacking supply unless large holders shift stance or on‑chain fundamentals change.
Where LINK could find support — key levels and buyer zones
Support zones are best understood as confluences of technical price history and on‑chain supply nodes. For LINK, prioritize the following areas (price levels are rounded, dynamic — use your platform for live quotes):
$8–$9: Short‑term on‑chain supply band — this is where a large tranche of liquid supply has clustered after the recent slide. Expect choppy action and potential whipsaws; large single‑day bounces are possible if sellers are exhausted.
$6–$7: Secondary accumulation node — historically, this is a deeper realised‑price band where longer-term holders and some protocol treasuries have acquired positions. If price reaches here, the reward/risk profile improves materially for patient buyers.
$4–$5: Structural low / panic zone — low probability in the near term but a clear capitulation area if macro markets deteriorate significantly. This band historically flips sentiment and draws opportunistic, long‑dated buyers.
Technical overlays to watch: volume by price (VPVR) for visible distribution nodes, exchange inflows (rising inflows can signal imminent selling), and realized price bands from on‑chain analytics. Coinpedia’s analysis on supply concentration helps explain why the $6–$9 area is especially relevant today [link above].
For traders tracking cross‑market correlations, remember that LINK often amplifies moves in Bitcoin and is sensitive to shifts in broader DeFi demand such as oracle usage on DeFi platforms.
Oracle narrative and developer adoption — fundamentals that can stabilize price
Chainlink’s fundamental case rests on two pillars: oracle adoption (pricing, data feeds, VRF, etc.) and developer integration across smart‑contract platforms. Even during price drawdowns, active integrations, new staking or service announcements and measurable on‑chain usage can blunt selling by offering a confidence floor to strategic buyers.
That said, narrative alone won’t stop price action driven by liquidity and macro flows. Developers and ecosystem partners will continue to be the long‑term buyers, but their buying cadence is typically slower and tied to utility metrics (calls to oracles, subscription volumes). Until on‑chain usage picks up materially or a clear reduction in sell pressure is observed, speculative flows and large holders will determine short‑to‑mid term price discovery.
In short: oracle adoption and developer traction are necessary but not sufficient to prevent continued downside in a liquidity‑driven market. They do, however, improve the asymmetry for longer‑term accumulation.
Three trading setups: practical plans for different horizons
Below are three disciplined, actionable setups: a short‑term mean‑reversion, a mid‑term breakout trade, and a longer risk‑managed accumulation plan. Each includes Rationale, Entry, Stop, Target, and Execution notes.
Setup A — Short‑term mean‑reversion (timeframe: days to 2 weeks)
- Rationale: In a stretched sell‑off with oversold technical indicators (RSI <30 on shorter timeframes, sharp intraday capitulation), quick bounces are common as spot liquidity imbalance attracts market‑makers.
- Entry: Look for a high‑volume wick reversal candle into the $8–$9 supply band, confirmed by declining exchange inflows and a short‑term RSI bounce. Partial entry at $8.60–$8.90.
- Stop: Tight, below the same candle low — e.g., 6–8% below entry depending on volatility.
- Target: 10–20% intraday to swing profit-taking near $10.5–$11 (previous support turned resistance).
- Execution notes: Use small position sizes (1–3% of capital), prefer limit entries, and be ready to scale out quickly. This is a tactical, non‑directional play — you’re buying a bounce, not the trend.
Setup B — Mid‑term breakout (timeframe: 2–8 weeks)
- Rationale: If LINK reclaims and sustains above $11–$12 on volume, it signals seller exhaustion and potential rotation back into altcoins. A breakout with on‑chain support (decreasing exchange balances, higher active addresses) compounds conviction.
- Entry: Wait for a daily close above $12 with above‑average volume and confirmed decrease in exchange balances or meaningful on‑chain demand signals.
- Stop: Below breakout retest — e.g., 8–12% below entry, set under last swing low.
- Target: Initial 25–40% to the next logical resistance band $15–$17; further targets based on momentum and fundamentals.
- Execution notes: This is a momentum trade — size moderately (3–6% of capital), use a tiered take‑profit plan and trail stops as price advances. Monitor oracle adoption headlines for reinforcing fundamentals.
Setup C — Risk‑managed accumulation (timeframe: months)
- Rationale: For allocators who believe in Chainlink’s long‑term role in web3 infrastructure, structured accumulation across the $6–$11 range reduces timing risk and respects on‑chain supply nodes.
- Entry plan: Dollar‑cost average (DCA) into three tranches: tranche 1 near $10–11, tranche 2 near $8–9, tranche 3 near $6–7. Adjust tranche sizes based on conviction (e.g., 40/35/25).
- Stop / Risk: Use portfolio-level risk limits rather than per‑lot stops; allocate a fixed percent of total portfolio (e.g., 1–3%) to LINK and do not exceed your predefined max exposure.
- Target: Build position for multi‑quarter horizon; treat price rebounds as opportunities to reduce new buys. Expect volatility and prioritize conviction over short‑term price moves.
- Execution notes: This plan is for fundamental allocators. Consider on‑chain signals such as rising active oracle calls or new integrations as catalysts to increase allocation. Platforms like Bitlet.app can help implement recurring buys and manage exposure without trying to time tops or bottoms.
Execution checklist & risk management
- Pre‑trade: Confirm macro environment (BTC correlation), check exchange flows, VPVR for immediate price bands, and any large wallet movements.
- Position sizing: Never risk more than your strategy allows; short‑term trades should be small and fully hedged with strict stops, whereas accumulation uses time diversification.
- News risk: Chainlink is sensitive to ecosystem announcements; place stop buffers around scheduled events if you don’t want event risk.
- Trade hygiene: Use limit orders where possible, monitor slippage, and journal entries/exits for future refinement.
Final thoughts — discipline over prediction
LINK’s current drawdown is the interaction of liquidity, concentrated holder behaviour, and a market that briefly lost faith in the short term. On‑chain indicators point to supply beneath the surface and a concentration of holdings that can cause repeated rejections unless a catalyst reduces sell pressure. Oracle adoption and developer activity remain the structural bulls’ case, but traders must be pragmatic: trade price and liquidity first, narrative second.
Whether you choose mean‑reversion bounces, momentum breakouts, or patient accumulation, the edge comes from clear rules, deliberate sizing, and monitoring on‑chain supply dynamics. Use the three setups above as templates, adapt them to your risk tolerance, and always respect the market’s tape.
Sources
- AmbCrypto: reporting on Chainlink slipping below $9 and the 21‑week drop AmbCrypto report
- Coinpedia: analysis highlighting supply building beneath the surface and critical LINK zones Coinpedia analysis
- CryptoPotato: review of altcoins that suffered during Bitcoin local lows for market context CryptoPotato market watch