Market Analysis
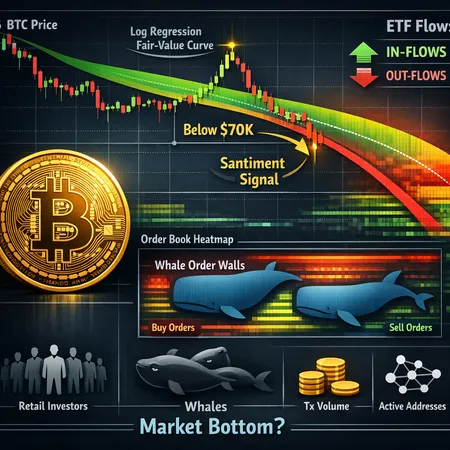
Bitcoin fell below $70k amid a spike in bearish chatter and renewed whale activity. This article weighs on-chain signals, analyst views, ETF flows and offers a practical trading playbook for intermediate traders and investors.

Elon Musk’s X Money public beta announcement sent memecoin markets into a flurry — Dogecoin briefly spiked on the news despite reports it was excluded from the initial offering. This article breaks down the price reaction, plausible reasons for DOGE’s omission, narrative consequences and practical strategies for traders and community managers.
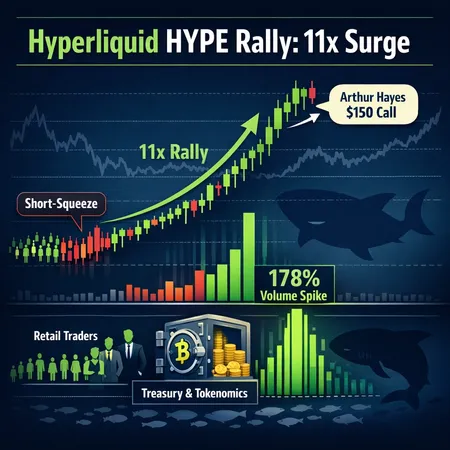
A data-driven breakdown of the HYPE token’s recent rally, tracing Arthur Hayes’ $150 price call through double-digit gains and a 178% volume spike, with an evidence-based assessment of drivers, sustainability, and trader playbook. Practical entry-sizing and risk-management rules included for active altcoin traders.
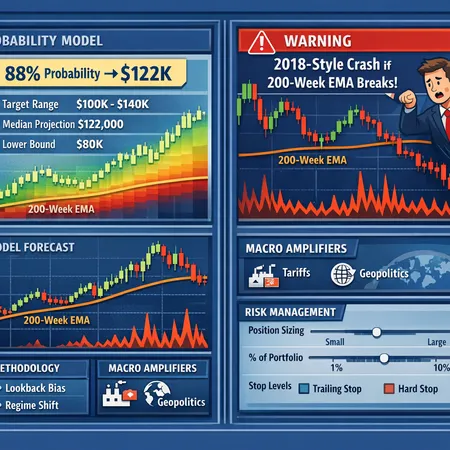
Two dominant narratives clash: statistical price models flagging an 88% chance of higher BTC vs technicians warning a 2018‑style crash if the 200‑week EMA breaks. This guide explains the methodologies, limitations, macro tail risks, and a practical framework for traders to size and manage exposure.

Despite a weak ETH price, on‑chain data shows record accumulation — a potentially bullish fractal that hides nuance around who’s buying and why. This deep dive parses the signal, staking concentration risks, and how Vitalik’s bolt‑on upgrade push could reshape the 2026 narrative.
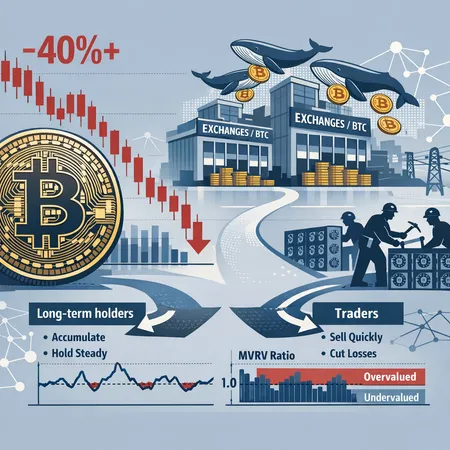
After a rapid 40%+ decline in BTC prices, investors must separate a tactical bounce from structural capitulation. This article analyzes the timeline, on-chain signals, whale selling and exchange inflows, miner and treasury implications, and concrete rules for positioning.

Bitcoin plunged roughly 15% from $98k to the low $80ks after a confluence of shrinking dollar liquidity, Fed‑chair chatter and a leverage/derivatives unwind. This article breaks down the drivers, key support levels ($84k, $75k), scenario mapping and practical trade and risk‑management ideas for spot and derivatives traders.
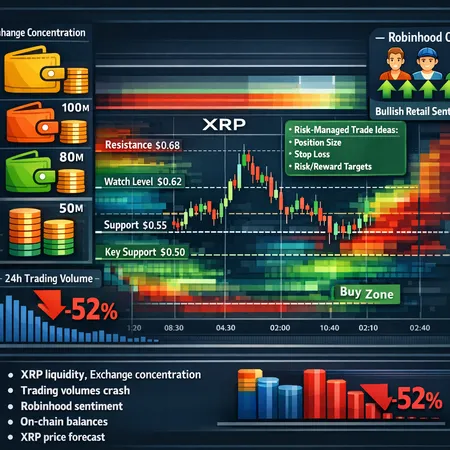
A focused microstructure review of XRP that unpacks exchange concentration, a 52% 24‑hour volume crash, and how bullish retail odds fit with on‑chain risks. Practical, risk‑managed trade ideas and watchlist levels aligned with recent price forecasts are provided for active traders.
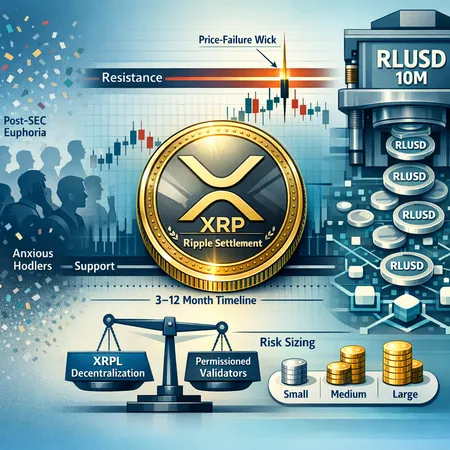
Ripple’s SEC settlement kicked off a rally — then the air leaked out. New on‑ledger activity like 10M RLUSD minted gives the XRPL a fresh narrative, but technical weakness and decentralization debates mean risk sizing matters more than ever.

A comprehensive, on‑chain and legal synthesis of XRP's market structure after the SEC vs Ripple closure and ahead of the Feb 1, 2026 1B XRP escrow unlock. Actionable scenarios and risk controls for active traders and long‑term holders.
DeFi
All DeFi postsBitcoin
All Bitcoin postsDerivatives
All Derivatives posts- Uncovering XRP’s Hidden Bull Case: Futures Surge, Ichimoku Flip, Reserve Decline and Institutional Signals
- Privacy‑Coin Resurgence: Why ZEC, XMR, DASH and DCR Ripped Higher in April 2026 — Risks & Trade Rules
- XRP’s Quiet Buildup: Do Derivatives, On‑Chain Flows and Ledger Resilience Signal a Real Breakout?