Why Bitcoin Dumped 15%: Dollar Liquidity, Fed‑Chair Fears, Liquidations and Near‑Term Scenarios
Summary
Quick narrative: what happened and why it matters
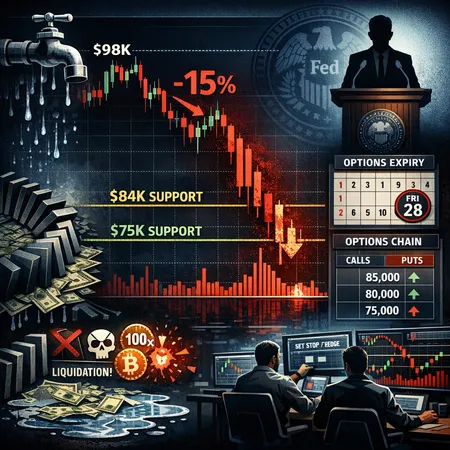
The market sold off roughly 15% in a short window — BTC dropped from near $98k to the low $80ks. For traders this felt familiar: an apparently strong trend that suddenly unravels when liquidity is thin and leverage gets clobbered. For many market participants the move changed the immediate risk profile: momentum readings rolled over, funding and basis reset, and short‑term options skews widened.
For context, remember that for many traders Bitcoin remains the primary market bellwether; a 15% move in BTC quickly ripples into altcoins, DeFi funding markets and cross‑exchange liquidations. Crypto is still a leverage‑heavy vertical — so when macro or micro drivers remove bids, the downside can cascade faster than on purely spot markets.
Driver 1 — shrinking US dollar liquidity: Arthur Hayes’ thesis
High‑level macro flows set the table. Former BitMEX CEO Arthur Hayes argued the proximate driver was a material drop in dollar liquidity — he linked the dip to roughly a $300B fall in available dollar liquidity that tightened financing conditions and drained margin capacity. That narrative matters because fewer dollars on the margin desks equals less capacity to absorb liquidations and delta hedging flows during stress, which magnifies price moves.
This liquidity view explains why the sell‑off wasn’t purely crypto‑native. With a tighter dollar matrix, cross‑asset dealers tighten risk limits and reduce two‑sided provision in riskier pools. The result: price moves get less well supported and forced sellers find fewer natural buyers. For a deeper read on this perspective see Arthur Hayes’ breakdown here.
Driver 2 — Fed‑chair nomination and macro policy fears
Macro headlines were the catalyst that tightened risk tolerance: chatter around the Fed‑chair nomination and renewed speculation on the future path of policy fed into the sell‑off. When a central bank appointment signals potential for a less accommodative stance, fixed‑income and funding markets reprice; that reprice works through funding rates and financing desks that underwrite derivatives and prime brokerage exposure.
Coverage noted the timing of Fed‑chair talk coinciding with the liquidation spike; some analysts tied the rhetoric to a cascade that cleared leverage around key levels. Coinpaper’s coverage showed how conversation around the Fed‑chair and subsequent liquidation cascades contributed to rapid downside pressure, with BTC briefly dipping into the low $80ks amid sweeping liquidations.
Driver 3 — liquidations, options positioning and the mechanics of the dump
The technical mechanics matter: leverage, concentrated option strikes, and stop clusters are the plumbing that turns a macro move into a cascade.
- Concentrated options expiries and pinned strikes create focal points where delta hedging by dealers becomes significant. When large option sellers are short call or put positions, dynamic hedging can add directional flows.
- Futures funding and concentrated long leverage mean that a small adverse move will trigger margin calls and auto‑liquidations. Liquidations beget more liquidations in tight liquidity conditions.
- Traders reported sweep patterns and forced deleveraging near the low $80ks region, consistent with the narrative of cascade liquidations and options‑driven flows; coverage of the dump highlights liquidation cascades tied to Fed‑chair talk and fast deleveraging.
Coinpaper documented how the BTC dump to ~$82.6k unfolded amid Fed‑chair talk and a cascade of liquidations, while Coinpedia summarized the depth of the drawdown and noted it had reached a two‑month low — both useful snapshots of how market microstructure and macro headlines aligned.
Technical supports and near‑term scenarios
Two horizontal levels command attention: $84k and $75k. These should be treated as structural pivots for the near term.
- $84k — first line of defense. This level is where we saw clustered past support and where delta hedging and stop‑loss orders concentrated during the recent move. Short squeezes can originate if buyers defend this level; conversely, failure here often triggers a faster drop because algorithms and stops sit below it.
- $75k — secondary pivot. If $84k does not hold, $75k is the next big structural level where longer‑term trader bids and institutional entry points may reappear. A break below $75k would broaden the market’s risk profile and make a multi‑week correction more likely.
Scenario map (near term, 1–6 weeks):
- Base case (40% probability): BTC stabilizes around $84k–$90k as liquidity restores, funding normalizes and option skews calm. Range-bound trading returns with lower realized volatility.
- Bounce + retest (35%): A sharp relief rally into $92k–$98k on short cover, but sellers reassert into that rally leading to a retest of $84k. This path creates multiple whipsaw opportunities for derivatives traders.
- Deeper unwind (25%): $84k breaks decisively on renewed macro weakness or another liquidity shock, pushing price toward $75k and possibly testing lower structural supports if macro tightness persists.
CryptoSlate’s reporting on Bitcoin fighting to stave off a fourth straight monthly slide gives a longer‑term momentum lens — if monthly momentum flips negative, downside scenarios become the path of least resistance for a while.
Practical risk‑management rules for spot and derivatives traders
For intermediate-to-advanced traders the right reaction is pragmatic: size down, hedge intelligently, and be aware of path risk (how the market gets from A to B). Below are concrete checks and tactics.
Position sizing and stops
- Trim exposure first. Reduce position size to a level where a 20–25% adverse move won’t threaten your entire capital allocation.
- Use staggered stop‑losses instead of a single hard stop. Example: scale trims at 8%, 15% and 25% drawdown bands depending on conviction.
Hedging and temporary protection
- For spot holders worried about a move below $84k, buy put protection or set up a collar: buy a longer‑dated put near current deltas and fund the hedge with short calls if willing to cap upside.
- For capital‑efficient hedges, consider selling OTM put spreads instead of naked puts to cap risk while still generating premium.
Futures and leverage tactics
- Lower leverage or avoid opening new large directional futures positions until funding normalizes and open interest stabilizes.
- If you are long futures and expect a bounce, a partial hedge via short dated ATM straddles (sold) is dangerous in high volatility; prefer buying protection (long puts) to preserve convexity.
- Beware of cross‑exchange funding arbitrage in periods of stress — basis can move quickly and liquidations can happen even if you think your margin is adequate.
Options and volatility plays
- Vol sellers: avoid naked short vega in these conditions unless you have a deep understanding of the gamma risk and access to immediate liquidity. Instead consider structured, capped strategies (e.g., short call spreads, short put spreads) with defined risk.
- Vol buyers: buying puts around $75k–$84k (scaled) can act as tail protection. Time decay works against you, so prefer concentrated short‑dated protection around expected event windows or monthly expiries.
- Monitor options expiries and key strike clusters; these can create magnet effects and generate hedging flows that accelerate moves into/away from certain levels (options expiry can be especially impactful in thin liquidity).
Practical liquidity and execution tips
- Use TWAP/VWAP slices if you’re moving large spot orders; avoid market orders during widened spreads.
- For derivatives, keep an eye on cross‑margin requirements and exchange maintenance margins. During stress, exchanges can raise intraday margins.
- Maintain a kill‑switch rule: a pre‑defined schedule for de‑risking after successive margin events or a quantifiable liquidity shock.
Trade ideas (conservative to aggressive)
Conservative
- Spot holders: scale out 10–30% into rallies above $92k and redeploy at lower prices or into stablecoin yields on platforms like Bitlet.app if you prefer capital preservation while waiting for a clearer trend.
- Protection: buy 1–3 month puts around current implied vols to cap tail risk; fund via sold OTM call spreads if you accept a capped upside.
Balanced
- Pair trade: go long spot (reduced size) and short near‑dated futures to capture basis normalization; this hedges some downside while keeping exposure to funding reversion.
- Options spread: buy a put spread (e.g., buy 0.9 delta put, sell 0.75 delta put) to create a cost‑efficient hedge with defined risk.
Aggressive
- Volatility swing: buy straddles or long gamma around expected macro prints (e.g., policy announcements), but keep strict size limits — long vega is expensive and time‑decays quickly.
- Directional short: sell a smaller size of deep OTM calls if you believe upside is capped near prior highs, funded with short‑dated put spreads — high risk and requires tight monitoring.
Checklist before adjusting positions
- Has funding or basis widened materially? If yes, reduce leverage.
- Are large options expiries or strike clusters coming up at key levels? If yes, expect potential magnet/stop runs.
- Has open interest dropped or spiked? Spikes with large one‑sided flow suggest forced re‑risking; drops suggest liquidity is leaving.
- Is the macro newsflow stable? Any surprising Fed commentary or market liquidity indicators? Macro shocks validate shifting to more defensive stances.
Final takeaways
The 15% move from $98k to low $80ks wasn’t a single‑factor event. It was the product of tighter dollar liquidity (as argued by Arthur Hayes), nervousness around Fed‑chair chatter and a rapid deleveraging amplified by options and futures plumbing. $84k and $75k are the near‑term technical anchors traders should watch; position sizing, defined hedges and disciplined execution matter far more than picking the exact bottom.
For those reallocating risk, consider the trade ideas above and keep execution conservative until funding and open interest stabilize. If you use platforms for installment or margin services, check liquidity and margin schedules — and remember that in stressed conditions spreads widen and execution can be materially worse than during calm markets.
Sources


