Is Bitcoin Carving a Cyclical Bottom in March 2026? $71k, Geopolitics and BTC Dominance Explained
Summary
Executive snapshot
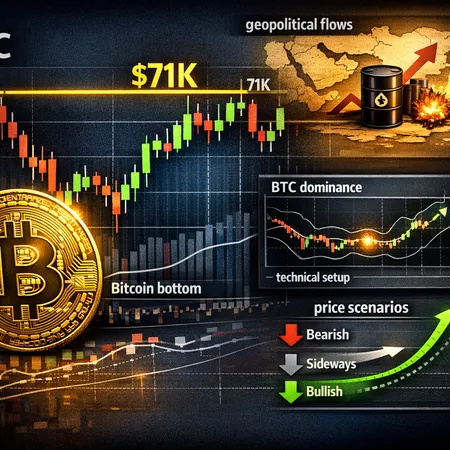
Bitcoin (BTC) touched the $68k–$70k band in late February and early March 2026, prompting a debate: is this the cyclical bottom that precedes a multi-month uptrend, or simply a pause before a deeper drawdown? The technical setup around a $71k level, macro flows driven by Middle East tensions and an unusual compression in BTC dominance together create a conditional — but tradable — thesis. This article breaks those inputs down and offers scenario-based plans and confirmation cues for traders.
Price context: recent action and the $71k technical trigger
After the brief push toward $70k, BTC failed to extend meaningfully above that region and retraced into the high-$60k area. Short-term momentum oscillators show a mix of exhaustion and potential for mean reversion. Importantly, some analysts have flagged $71k as the key pivot that separates bullish continuation from neutral-to-bearish structure. See the recent technical decode arguing that $71k may be the threshold for the next directional move: Cred’s $71k threshold analysis.
A close above $71k on decent volume would validate near-term bullish structure, converting a series of lower highs into an attempted breakout. Conversely, repeated rejections at or below that level would keep the risk skewed to the downside.
Macro drivers: geopolitical flows and oil’s knock-on effects
Geopolitics is no longer background noise. The recent spike in Middle East tensions pushed oil prices higher and induced cross-asset risk-off flows that temporarily supported safe-haven bids — and also generated liquidity demands for fiat. Coverage of Bitcoin’s $70k run attributed part of the retreat to geopolitically-driven market sentiment shifts: market coverage on the $70k run and retreat.
How this matters for a bottom test: geopolitical shocks can do two things at once. They can spur fresh inflows into perceived hedges, and they can force deleveraging that sells volatile assets like BTC to meet margin and liquidity needs. If the next phase of tensions persists and global fixed-income or FX liquidity tightens, BTC could see more volatile chop — making a clean bottom less likely. On the other hand, if tensions stabilize, the liquidity freed from risk-off rotations can amplify an uptrend.
Market structure: BTC dominance squeeze and longer-term growth curves
A distinct, longer-running signal is the compression in BTC dominance. Analysts have observed a multi-year Bollinger-band-style squeeze in BTC dominance metrics — a pattern that preceded either an altcoin season or an extended consolidation under previous cycles. See analysis of the seven-year squeeze in dominance here: BTC dominance Bollinger squeeze analysis.
Why dominance matters for a cyclical bottom: if BTC re-accelerates while dominance expands, capital is rotating back into BTC from altcoins — a classic sign of a market-wide flight to perceived relative strength. If dominance continues to compress and altcoins outperform, BTC can grind higher without a strong breakout, or BTC might lag while other market segments lead the next run.
There’s also a long-term, structural framing that some analysts use: historical growth-curve projections and Elliott-style extensions that place very bullish targets — for example, a stretched $280k scenario that resurfaces periodically in growth-curve forecasts. That projection is more useful as a long-horizon anchor than as a short-term trade signal: growth-curve $280k projection. Traders should treat such targets as regime-level objectives, not immediate confirmations of a bottom.
Integrating signals: the three practical scenarios
Below are scenario-based outlooks that merge the technical setup, macro flow environment and market-structure signals. Each scenario includes the key confirmation rules and what it implies for position construction.
Scenario A — Bear continuation (high risk of deeper drawdown)
- Setup: BTC repeatedly fails at the $71k level, risk-off flows persist due to worsening geopolitical headlines, and BTC dominance either falls or remains structurally weak.
- Confirmation: Multiple rejections at $71k, a decisive daily close below the high-$60k support band on volume expansion, and macro liquidity tightness (rising yields, widening FX stress indicators).
- Trade plan: Avoid fresh directional long exposure; consider short-biased strategies or put/collar hedges if leveraged. Tight stops above interim resistance; scale exposure small.
Scenario B — Extended consolidation (range-bound rebuilding)
- Setup: BTC trades sideways between roughly $60k–$72k for several weeks while dominance compresses and altcoins rotate.
- Confirmation: Choppy volume profile, intraday breakouts quickly fade, and macro headlines oscillate without sustained trend. BTC trades below $71k but above key support with decreasing volatility.
- Trade plan: Range strategies (mean-reversion buys near support, cautious shorts near resistance). Favor smaller position sizes and explicit time stops. Use BTC dominance readings to favor altcoin vs BTC exposure.
Scenario C — New uptrend (bullish breakout)
- Setup: Clean breakout above $71k with follow-through, macro drivers calm or become BTC-friendly (capital flows into hard assets), and BTC dominance begins to expand.
- Confirmation: Daily close above $71k on above-average volume and a subsequent retest that holds as support; momentum indicators ramp; and macro cross-asset signals (declining volatility, stabilized oil) support risk-on allocation.
- Trade plan: Add to momentum longs on confirmed breakout; use trailing stops and layered scaling. Consider allocating larger size if dominance expands, signaling broad market participation.
Actionable indicators and exact triggers to watch
Below is a checklist traders can use to confirm or invalidate a cyclical bottom thesis. These are deliberately specific so you can automate alerts or build discipline into a trading plan.
- Price triggers: daily close above $71,000 (primary long-confirmation) or a daily close below the high-$60k support band (primary short-confirmation).
- Volume: breakout volume above 20–30% of the prior 30-day average strengthens breakout validity; breakouts on thin volume are suspect.
- BTC dominance: watch for a weekly close that turns higher off recent lows; an expanding dominance makes a BTC-led rally more probable. See discussion of the dominance squeeze for context: dominance squeeze analysis.
- Macro cross-checks: oil price trajectories and risk-liquidity indicators. If geopolitical risk eases and oil stabilizes, BTC has a cleaner path higher; if oil and commodity-linked FXs keep flashing stress, downside risk rises. For background on how geopolitics affected the $70k flip, refer to contemporary coverage: recent coverage of the $70k run and retreat.
- On-chain/derivatives: falling exchange netflows, declining open interest liquidation clusters at support, and improving realized profit metrics support a bottom thesis. Traders should monitor funding rates — persistent negative funding during a bounce suggests short-seller dominance.
Trade discipline and risk management
Regardless of the favored scenario, discipline matters. Use explicit position sizing tied to account risk (e.g., no more than 1–3% on a single leveraged trade), set stop losses based on technical invalidation points (weekly close below structural support for longs), and avoid over-leveraging into binary breakout points. For investors building a longer-term exposure, dollar-cost averaging through the consolidation band reduces timing risk.
Also, keep an eye on the broader narrative: long-term growth-curve targets such as the $280k projection are useful as macro anchors but dangerous as trade entry signals without intermediate confirmations like the $71k breakout or dominance expansion. For an argument supporting a sustained rally, see the multi-month uptrend thesis: why BTC could enter a multi-month uptrend.
Practical checklist for next 2–8 weeks
- Set alerts for daily closes above $71k and below the high-$60k band.
- Monitor BTC dominance weekly closes and an altcoin/BTC ratio for rotation signals.
- Watch volume on breakouts and retests; prefer trades with volume confirmation.
- Keep macro contingency: if geopolitical headlines spike, tighten stops and reduce size.
Closing take
Is Bitcoin carving a cyclical bottom in early March 2026? The evidence is mixed but actionable. A clear daily close above $71k with volume and rising BTC dominance would be the cleanest confirmation of a bottom and a shift toward a new uptrend. If $71k fails repeatedly amid worsening macro liquidity, expect more chop or deeper downside. Traders should rely on specific, pre-defined triggers — not on wishful thinking — and keep risk tight.
For team-level execution and building scenario-based trade plans, many desks are combining technical thresholds like the $71k level with macro watchlists and dominance metrics to govern sizing. Tools and platforms for managing split allocations and staged entries — including Bitlet.app for installment and exit planning — can help implement these rules without emotional overtrading.
Sources
- https://u.today/is-71k-new-ceiling-for-bitcoin-analyst-decodes-latest-btc-technical-setup?utm_source=snapi
- https://thecurrencyanalytics.com/altcoins/bitcoin-hits-70k-then-retreats-as-markets-flip-hard-245687
- https://beincrypto.com/why-bitcoin-could-enter-a-multi-month-uptrend/
- https://coinpaper.com/15109/bitcoin-price-prediction-280-k-target-reappears?utm_source=snapi
- https://blockonomi.com/bitcoin-dominance-bollinger-bands-hit-seven-year-squeeze-altcoin-season-or-extended-pain/


