Dissecting XRP’s January 2026 Breakout: Flows, Tech Levels and What Comes Next
Summary
January’s move: a snapshot
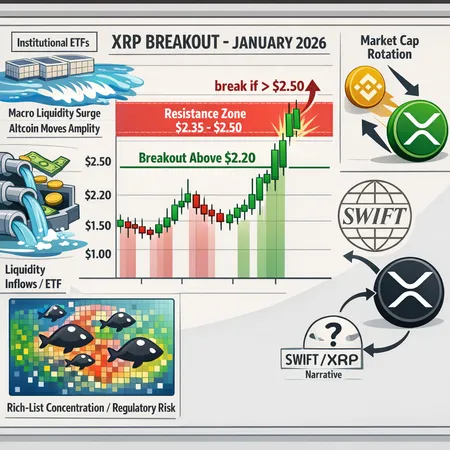
XRP’s jump above $2.20 in January 2026 looked abrupt on price charts but was preceded by clearly visible flow signals. On one notable day the market absorbed what on‑chain trackers described as a very large net inflow, a liquidity event that helped lift price execution and broke short‑term congestion. That single‑day swing — widely reported as a multibillion‑dollar inflow — became the ignition point for the current leg higher and coincided with XRP briefly overtaking BNB in market cap, a classic sign of market cap rotation among altcoins.
What the inflows tell us (and why they mattered)
Large inflows matter for two reasons: they supply the liquidity needed to clear resting sell orders at the highs, and they change the short‑term supply/demand balance. Data sources tracking fund and exchange flows flagged a >$13 billion inflow on the strongest day of the rebound, a volume shock that makes a breakout both more durable and more volatile at the same time (see reporting on the inflow numbers).
The inflow narrative ties directly to the phrase liquidity inflows in trader conversations. When liquidity pours into a token like XRP, slippage becomes less of a constraint for larger market participants — and momentum traders chase prices, creating a feedback loop. This is part of why we saw market cap rotation from BNB toward XRP: speculators and some institutional desks repositioned into a faster‑moving story.
For context on timing and market‑cap dynamics, coverage that tracked XRP reaching $2.28 and overtaking BNB is useful to review to understand how price and perception aligned during the squeeze.
Supply distribution and the rich‑list risk
On‑chain snapshots show a concentrated distribution of XRP among the largest wallets — an important caveat for anyone sizing a position. The top wallets hold a material portion of circulating supply, which creates asymmetric risks: a few large sells can swamp thin order books near local highs, but coordinated accumulation by those same wallets can also sustain rallies.
Rich‑list analysis suggests concentration is nontrivial, and traders should treat that as a conditional factor when planning exits: liquidation from a handful of addresses could create sharp, fast drawdowns even if macro liquidity remains positive. This is the flip side of the liquidity inflow story — the same movement that pushes price up can also cluster supply in the hands of a few.
The narrative layer: SWIFT, adoption and headlines
Beyond flows and on‑chain metrics, narratives drive capital allocation. In January 2026, discussion about how XRP might fit into global payments rails — specifically connections to SWIFT-type messaging and cross‑border settlement narratives — resurfaced in mainstream crypto commentary. That framing, whether technically precise or partly speculative, attracts attention from treasury desks and payments-focused funds because it hints at actual utility beyond pure speculation.
Narratives can be self‑reinforcing. If market participants believe XRP will see greater payments adoption or integration with legacy systems, they reposition risk capital accordingly. However, narratives also increase regulatory and reputational scrutiny: promises of enterprise integration draw questions about compliance, custodianship, and whether large holders will be subject to different treatment.
Technical picture: resistances and what a break means
Price has clustered into a clearly defined range, with the most significant resistance levels identified in the $2.35–$2.50 band. Technical commentators highlighted near‑term obstacles around $2.41 and $2.50 — levels that represent prior distribution zones and psychological round numbers. A decisive break above $2.50 on above‑average volume would do two things:
- Create a cleaner path toward higher targets measured from the breakout base (measured‑move targets point to mid‑$3s depending on chosen reference).
- Force a rotation of short gamma positions and trigger buy stops above recent highs, which often accelerates price advances.
Conversely, failure to conquer $2.35–$2.50 with waning volume or a quick reversal into the breakout zone would suggest the move was flow‑driven and not yet price‑structure driven — increasing the likelihood of a retracement to support near $1.60–$1.90 depending on where weekly demand pools form.
When trading the breakout, watch for two confirmations: sustained volume above the 30‑day average and follow‑through from institutional channels (ETF or fund inflows being one measurable proxy). For many traders, Bitcoin strength or weakness also sets risk appetite for altcoin continuation moves.
Institutional flows and ETF influence
Institutional participation — whether through ETFs, over‑the‑counter desks or custody desks at prime brokers — amplifies volatility and can extend rallies when flows are persistent. ETF flows in particular add a predictable, quantifiable liquidity stream: daily net inflows into a themed product can create a base bid that altcoins can piggyback on during market cap rotation phases.
When macro liquidity conditions are easy (lower yields, ample USD liquidity), risk assets including altcoins benefit disproportionately. The January XRP rally looked partly like a beneficiary of that environment: money rotated out of previously leading alts and into a higher‑momentum name. For traders, the interaction between macro commentary, ETF flows and on‑chain inflows is a powerful trifecta to monitor.
SWIFT ties and regulatory implications
Claims that XRP might be used alongside or within SWIFT messaging frameworks reappear cyclically and can be market catalysts. Discussions in industry press have speculated on how XRP could complement cross‑border settlement rails. Even if the narrative is not yet realized in widespread production deployments, the possibility raises two real impacts for price: speculative demand from funds and increased scrutiny from regulators and banks.
Regulatory scrutiny matters because it increases the chance that large holders (from the rich list) or service providers will have to alter holdings or behavior. The intersection of adoption narratives and concentrated holdings therefore becomes a primary risk vector.
Practical trade frameworks for traders and token researchers
If you want a concise, actionable view for entries and exits during this regime, consider the following trade framework based on the flow/technical synthesis above:
- Entry: stagger buys on pullbacks to key intraday/weekly supports. A conservative entry is on a retest of the $1.90–$2.05 zone after a high‑volume breakout; an aggressive entry is on break above $2.50 with volume confirmation.
- Stops: place initial risk below the next structural support (e.g., weekly demand near ~$1.60) sized to acceptable portfolio risk. Tight intraday stops are reasonable for momentum scalps; wider stops make sense for swing trades.
- Targets: partial profits at the first resistance cluster ($2.35–$2.50) and scale further into measured‑move targets if above‑average institutional flows continue. Use trailing stops to protect unrealized gains during fast moves.
- Sizing: reduce position size if on‑chain richness indicates concentration among top holders — that makes large, idiosyncratic dumps more probable.
A simple checklist before adding to a position: volume confirmation, sustained ETF/institutional headlines or flow data, and absence of single‑wallet behavior that looks like coordinated accumulation or distribution.
How to monitor the situation going forward
- Watch inflow metrics daily (exchange net flows, fund flow reports) and note whether inflows are persistent or one‑off spikes.
- Track wallet movement among top holders (the rich list) for unusual transfers to exchanges or OTC custodians.
- Observe interactions between Bitcoin strength and XRP momentum; altcoin rallies often need broader risk‑on tape to sustain.
- Follow headlines about SWIFT partnerships carefully: tangible pilot announcements matter far more than op‑eds.
For traders using platforms for order execution or portfolio tracking, integrating flow data with technical alerts gives an edge. Bitlet.app users, for example, may find it useful to correlate trade execution with on‑chain flow dashboards when timing entries.
Final thoughts — balance upside and concentrated risk
XRP’s January 2026 breakout is a classic case where flows and narratives combine to produce outsized moves. Liquidity inflows provided the fuel, market‑cap rotation placed XRP in the spotlight, and the SWIFT narrative supplied conviction for some buyers. Yet concentrated supply on the rich list and critical resistance in the $2.35–$2.50 band are active risk factors that can create sharp corrections.
Traders should therefore treat this as a high‑information, high‑risk setup: plan entries around confirmed flows and volume, size positions recognizing concentration risk, and use resistance bands as logical profit‑taking levels. For token researchers, the episode is a reminder that price moves are rarely driven by a single variable — they’re the emergent result of flows, narratives and the underlying distribution of supply.