How U.S. Spot Bitcoin ETF Inflows Are Changing BTC Price Discovery and Liquidity
Summary
Executive snapshot: why the recent ETF inflows matter
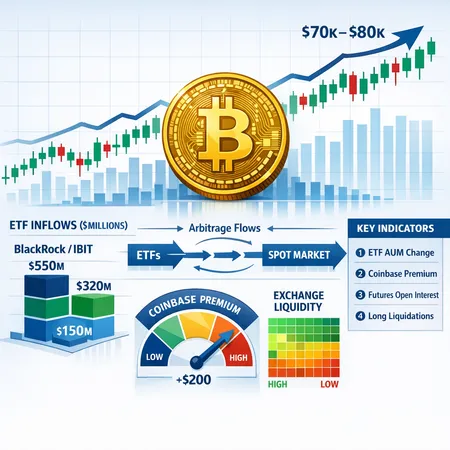
Over the last several days U.S. spot Bitcoin ETFs absorbed a sizeable amount of capital — roughly $1.1 billion over three days, with notable contribution from BlackRock’s product. That pace of inflows matters because ETFs change how dollars become BTC: authorized participants (APs) and custodians source coins, which can pull liquidity off explicit exchange order books and into long‑term cold storage. For many traders, Bitcoin price moves today are as much about where liquidity sits as they are about raw demand.
Two quick data points to anchor the discussion: CoinDesk reported the $1.1B three‑day inflow surge, and Cointelegraph’s SoSoValue data showed a short‑term reversal led by BlackRock’s IBIT. These are not one‑off trickles — the flows are large enough to show up in price discovery, funding dynamics, and the often‑watched Coinbase Premium.
What the data shows: who is buying and how big it is
- BlackRock (IBIT) has repeatedly shown up as a lead buyer in recent windows, with media coverage describing large purchases and ETF inflows on specific days (for example, a Feb. 25 report noting about $507M in inflows tied to heavy buying activity). See coverage showing both issuer‑level activity and daily inflow totals.
- Aggregated U.S. spot ETF flows added ~$1.1B over three days, signaling concentrated institutional accumulation rather than dispersed retail buys.
Institutional flows of this magnitude matter for price discovery because they are predictable and persistent: ETFs create shares that represent on‑chain BTC held by custodians, and the creation process often requires buying actual BTC in the spot market. That creates a structural, recurring demand stream that is different from one‑off speculative orders.
How ETF flows interact with Coinbase Premium and on‑exchange liquidity
The ETF arbitrage mechanism is central to understanding short‑term premiums and liquidity compression. Here’s the simplified chain:
- ETF issuer needs BTC to back newly created shares.
- APs or market makers source BTC — often from major spot venues or OTC desks — which reduces exchange order book depth.
- If buying pressure is concentrated on venues like Coinbase (a common liquidity hub), the spot price there can trade at a premium versus a global index. Traders watch this Coinbase Premium to see where real buying is being absorbed.
A sustained positive Coinbase Premium often indicates persistent ETF buying or OTC fills sourced from exchange liquidity. Arbitrageurs close that premium by buying cheaper BTC elsewhere and selling to the ETF creation desk, or by using futures; but if the inflow outpaces available bias‑free supply, the premium can persist and create a feedback loop that amplifies spot price moves.
Relatedly, as custodians move BTC off‑exchange into cold storage to back ETF AUM, on‑exchange reserves decline. That thinning of sell‑side depth increases price impact for large trades and makes short squeezes and rapid breakouts more likely.
Why these inflows can make a bottom more probable — and why they can fuel a breakout
Two structural effects increase the odds of a more durable bottom and a potential breakout toward $70k–$80k:
- Demand stickiness. Institutional ETF buys tend to be steady and allocation‑driven, not momentum chases. Dollars converted into ETF shares usually mean BTC held in custody for medium to long horizons, which removes supply from the active market.
- Liquidity compression. As exchange inventories fall, it takes less buying pressure to move the price materially. A series of big daily inflows can therefore lead to outsized price moves higher as the market re‑prices the level at which supply and demand balance.
Combine those mechanics with market psychology: once investors perceive a structural buyer (ETFs) is mopping up supply, marginal sellers resist exiting positions until higher prices, which tightens liquidity even further — a recipe for a breakout. Historical and current price action shows that when ETF flows compress liquidity and coincide with low exchange balances, moves can accelerate toward prior highs (in this case the $70k–$80k zone).
The other side: concentrated buyers and liquidation risks
The bullish story has a clear counterweight. Large, concentrated buyers and elevated leverage in derivatives markets create tail‑risk:
- Concentration risk. If a few issuers or APs dominate inflows, their behavior (including hedging or rebalancing) can introduce abrupt supply into the market if they shift strategy or need to raise cash.
- Leveraged positioning. Futures open interest and funding rates tell us how crowded the long trade is. The market saw real stress recently: Bitcoin held near ~$67k after a session that erased $252M in long liquidations — an example of how quickly leveraged positions can unwind and amplify moves. Short‑term liquidations can easily override ETF buying if they trigger sudden directional selling or forced selling from counterparties.
In short: ETF demand reduces spare supply, but it doesn't eliminate volatility. A concentrated buyer that pauses, or a leverage‑driven flush, can still produce sharp drawdowns.
Practical indicators investors should monitor (and how to read them)
Below are the most actionable signals to watch if you want to trade around ETF flows and price discovery:
- ETF AUM and daily net flows by issuer. Track creations/redemptions and the net inflow number. Large, sustained inflows (e.g., several hundred million over consecutive days) are a directional fuel source. Watch issuer‑level data to see who’s leading (BlackRock/IBIT, etc.).
- Coinbase Premium. A sustained positive premium suggests buying concentrated on Coinbase or APs sourcing coin there. If premium widens while ETF inflows are large, expect reduced liquidity and higher volatility.
- On‑exchange BTC reserves. Falling balances across major exchanges indicate less available sell liquidity; watch the pace of decline, not just levels.
- Futures open interest (OI) and funding rates. Rising OI with positive funding rates suggests crowded longs; that increases liquidation risk. A sudden funding spike followed by price weakness can precede a wave of long liquidations.
- Long liquidation prints. Large one‑off liquidation events (like the ~$252M wipeout recently reported) are early signs that leverage is fragile — and that a short‑term reversal could overwhelm ETF absorption.
- Cash‑futures basis and basis swaps. If the basis flips (spot > futures), it signals immediate spot scarcity and strong net buying pressure from ETF demand.
Monitoring these in combination — not in isolation — is crucial. For example, ETF inflows + falling exchange reserves + rising OI + widening Coinbase Premium is a stronger bullish confluence than any single signal alone.
A simple decision framework for intermediate traders
- If ETF flows are steady, Coinbase Premium is positive but not extreme, exchange reserves decline slowly, and OI is moderate: bias toward accumulation or being long with defined risk.
- If ETF flows spike sharply while OI is already high and funding rates go parabolic: proceed cautiously. Consider reducing size or hedging because forced liquidations can overwhelm ETF demand temporarily.
- If ETF inflows slow or reverse while exchange reserves bounce and Coinbase Premium collapses: the structural buyer might be pausing — watch for mean reversion and give room to price pullbacks.
Keep Bitlet.app and exchange dashboards handy for trade execution and monitoring; having low‑friction access to on‑chain and exchange data is helpful when these flows accelerate.
Final takeaways
U.S. spot Bitcoin ETF inflows have moved from theoretical to measurable drivers of price discovery and liquidity. Large, repeated inflows — led by big issuers such as BlackRock’s IBIT — can thin exchange liquidity, create a persistent Coinbase Premium, and raise the odds of a bottom or rapid breakout to the $70k–$80k range. But concentrated buyers and crowded leverage mean the market remains fragile; sharp liquidations can produce violent drawdowns even amid structural accumulation.
For intermediate to advanced investors, the edge comes from watching ETF AUM and flows, Coinbase Premium, exchange reserves, and derivatives metrics together. That multi‑angle view tells you whether ETF demand is being absorbed or whether the market is set up for a short squeeze followed by mean reversion.
Sources
- U.S. spot Bitcoin ETFs set for biggest week in 6 after adding USD1.1 billion in three days (CoinDesk)
- Bitcoin ETFs $1B inflows and three‑day reversal led by BlackRock (Cointelegraph)
- BlackRock snaps up BTC as U.S. spot ETFs see $507M inflow (Crypto.News)
- Bitcoin holds near $67K after $252M long liquidation wipeout (Coinpaper)