Bitcoin 2026: An Integrated Forecast from ETF Flows, On‑Chain Signals and Macro Drivers
Summary
Executive snapshot
Bitcoin's path into 2026 will be determined at the intersection of three forces: institutional flows into spot‑BTC ETFs, on‑chain supply dynamics driven by long‑term holders, and macro drivers — principally the dollar and Fed policy. Recent year‑end data show continued net inflows into spot ETFs, while on‑chain reads indicate long‑term holder selling has slowed or stopped; together these reduce supply overhang. Yet outcomes still hinge on whether the dollar softens and the Fed eases, a classic macro cross‑road for BTC. Below I synthesize flows, on‑chain analytics, macro scenarios, representative 2026 price estimates, and practical tactical playbooks for investors.
Spot‑Bitcoin ETF flows: what the year‑end picture tells us
Institutional demand is the clearest measurable change in market structure over the last 12–18 months. Near year‑end, spot ETFs continued to attract capital — The Block reported roughly $355 million in net inflows around that period, evidence that institutional allocations to BTC are persistent rather than episodic. That steady bid matters for liquidity: ETFs concentrate buying power and reduce the need for large OTC or exchange‑based purchases to move material size.
What this implies: spot ETF inflows are not a one‑time shock. If flows continue on the same cadence, they will systematically absorb new supply (miners, margin liquidations, and opportunistic sellers), which supports a structurally higher floor for BTC over time. For many traders, Bitcoin remains the primary market bellwether, so ETF flows also alter correlated asset flows across crypto.
On‑chain signals: long‑term holders and supply relief
On‑chain analytics show a meaningful behavioral shift. Recent analysis indicates long‑term holders — historically the marginal sellers after rallies — have largely stopped net selling. Reports and on‑chain commentary suggest that accumulation or at least holding behavior has increased, implying less circulating supply available to meet demand spikes.
Why that matters: when long‑term holders pause selling, the market loses a key reservoir of supply cushion during rallies. Combine that with continuous ETF demand and the result is amplified upside for a given bid. For portfolio managers building exposure, this convergence of ETF absorption and on‑chain supply restraint is a structural bullish input for 2026.
Macro drivers: the dollar, the Fed, and their transmission to BTC
Macro remains the wildcard. Two levers dominate BTC's macro sensitivity: the US dollar (DXY) and the Federal Reserve's interest rate stance.
A softer dollar historically correlates with risk‑asset inflows and a stronger BTC bid, because it reduces the real return on cash and elevates dollar‑denominated asset appeal. Thought pieces and market analyses have argued that a cycle of dollar weakness combined with Fed easing could be a strong tailwind for BTC.
Conversely, if the Fed remains restrictive or the dollar re‑strengthens (driven by surprise data or geopolitical safe‑haven flows), BTC's high volatility and growth‑like bet profile could suffer.
Detailed macro scenarios are covered below, but point‑blank: BTC is no longer just a crypto narrative — it's a macro instrument that reacts to liquidity, real rates, and currency moves. See further discussion on macro links in external analysis about how a softer dollar and Fed easing could drive BTC higher.
Representative 2026 BTC price estimates and rationales
Analysts' 2026 price forecasts vary widely. A recent overview gathered a broad set of estimates and rationales, ranging from conservative expectations to highly bullish outcomes based on continued institutional adoption and supply dislocations. The contrast is useful because it clarifies assumptions.
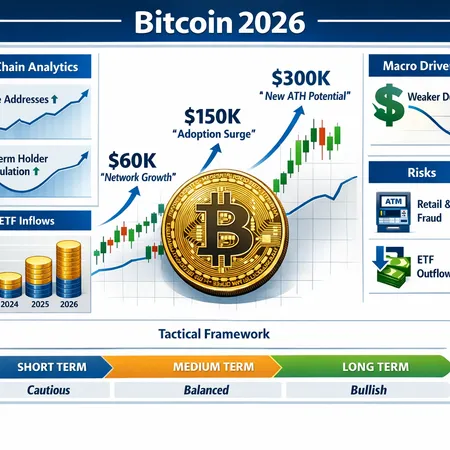
Bull case (e.g., upper‑end analyst models): BTC > $200k by 2026. These assume persistent, accelerating spot ETF flows, a material drop in dollar strength, Fed easing that reduces real yields, and continued on‑chain accumulation by long‑term holders.
Base case: BTC $60k–$120k. This scenario presumes steady ETF demand (similar to current inflow rates), partial Fed easing, and long‑term holders staying mostly dormant, with periodic retail profit‑taking limiting sustained parabolic moves.
Bear case: BTC <$40k. Scenarios here include ETF outflows, a surprise hawkish Fed, or renewed retail/market stress (including fraud or ATM/fiat‑rail disruptions) that reignites selling.
For a catalog of different forecasters and the range of rationales, see a summary of 2026 predictions and their drivers.
Key risk scenarios — what can derail the bullish thesis
ETF re‑rating or outflows: If macro shocks prompt institutional deleveraging, spot ETFs could see net outflows. Given their structural role in absorbing supply, a reversal would quickly remove a major buyer and could accelerate downside.
Retail/ATM fraud and fiat‑rail issues: Operational breakdowns, scams, or large ATM‑related fraud waves can reduce retail participation and create negative sentiment. These events matter because retail often supplies the liquidity that smooths drawdowns.
On‑chain black swans: Unexpected large‑scale transfers from long‑term holders or concentrated miner dumps would reintroduce supply pressure. Monitoring key wallet flows and miner sell schedules remains essential.
Macro shock: A surprise tightening cycle, a USD rally, or a geopolitical shock that sends capital into the dollar would test BTC's correlation with risk assets.
Each risk is actionable: ETF outflows and macro shocks are fast‑moving and require nimble hedging; on‑chain supply spikes are detectable ahead of full market impact; retail fraud is a structural reputational risk that can sap demand growth.
Tactical positioning by investor horizon
Below are tactical frameworks — not prescriptive advice — for allocating to BTC as we move toward 2026. Tailor percentages to your risk budget and mandate.
Active trader (horizon: days–months)
- Focus: volatility & event risk. Use options and tight risk management.
- Tactics: trade ETF flow data and macro prints; favor mean reversion around major macro releases. Keep position sizes small relative to NAV and use stop losses.
Intermediate investor (horizon: 3–12 months)
- Focus: thematic exposure to ETF inflows and on‑chain signals.
- Tactics: ladder entry using dollar‑cost averaging tied to macro indicators (e.g., DXY falling or dovish Fed surprises). Consider protective put spreads across key support bands.
Strategic allocator (horizon: multi‑year)
- Focus: long‑term store‑of‑value and institutional adoption.
- Tactics: build a core position (e.g., 1–5% of portfolio for diversified mandates, higher for crypto‑native mandates) and top up during drawdowns. Use installment or earn features on regulated platforms like Bitlet.app to optimize acquisition and yield, but evaluate custody risk.
Risk management overlay (all horizons): size to drawdown tolerance, stress test for ETF outflow scenarios, and monitor on‑chain indicators (long‑term holder balance changes, miner outflows).
Integrated timeline and triggers to watch into 2026
- Immediate (next 3 months): ETF weekly inflows/outflows, net realized flows, and long‑term holder balance delta. Watch macro data: CPI, PCE, and Fed commentary.
- Medium (3–9 months): dollar trend and any confirmed Fed easing. Persistent ETF inflows alongside a falling DXY materially raise the odds of a bullish regime change.
- Long (9–24 months): structural adoption signals — custody adoption at banks, corporate treasuries, and product innovation that widens on‑ramp capacity.
Key triggers:
- Sustained ETF inflows above the current rate: increases upside probabilities.
- Net selling resumption by long‑term holders: raises bearish risk.
- A coordinated USD weakness + Fed easing: highest‑probability bullish compounder.
How to monitor signals in practice
- ETF flows: track weekly and monthly net flows (public filings and aggregator reports such as The Block).
- On‑chain analytics: monitor long‑term holder wallet cohorts, miner transfers, and exchange inflows/outflows.
- Macro: DXY trend, real yields, and Fed dot plot shifts.
Combining these inputs into a simple dashboard gives portfolio managers a live 'probability tilt' — overweight, neutral, underweight — that can be adjusted dynamically rather than via binary bets.
Conclusion: a probability‑weighted view
Synthesis suggests a base‑to‑bull tilt into 2026 conditional on the continuance of spot‑ETF inflows and a pause in long‑term holder selling. If the dollar softens and the Fed eases, the structural setup (ETF demand + on‑chain supply restraint) could support materially higher BTC levels. Conversely, ETF outflows or a surprise tightening would push the narrative toward the downside quickly.
For intermediate investors and portfolio managers, the practical approach is probability weight scenarios, size exposure to drawdown tolerance, and monitor three buckets of indicators: ETF flows, on‑chain holder behavior, and macro (dollar + Fed). That integrated framework turns noisy headlines into actionable investment signals.
Sources