Reconciling BTC’s Conflicting Signals: 88% Rally Models vs 200‑Week EMA Crash Risk
Summary
The tension: model probabilities versus technical catastrophe calls
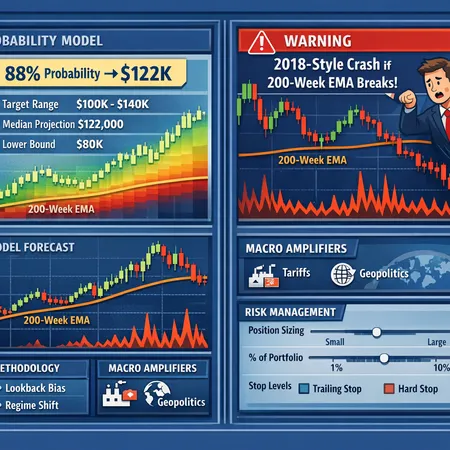
In recent market commentary two narratives have dominated: a family of historical price models signaling an 88% probability that BTC trades higher within the next 6–10 months and technical analysts warning that a break below the 200‑week EMA would trigger a 2018‑style capitulation (30–60% drawdown). Both claims can be empirically motivated, yet they imply very different posture for traders and risk officers. The goal here is not to crown a winner but to build a methodical way to weigh, stress, and size positions when statistical forecasts clash with technical and macro warnings.
For many traders, Bitcoin remains the primary market bellwether; blending statistical and technical views — while explicitly modeling macro tail risk — reduces the chance of being surprised by a regime shift.
How the 88% probability models work (and why they’re persuasive)
Models that report an 88% chance of BTC ending higher typically use historical analogues, moving-window returns, and conditional probabilities derived from past cycles. They often follow a simple recipe:
- Select a set of conditioning variables (time since previous halving, momentum, trend filters).
- Define a lookback universe (past N cycles or years).
- Compute the frequency with which price moved higher in a fixed horizon after the conditioning state occurred.
- Report the empirical probability and a target derived from average or best‑case historical outcomes.
Two contemporary writeups that highlight this approach argue the historical frequency of positive outcomes is near 88% under similar conditions, and extrapolate a target toward the $100–122K area as a plausible upper bound when the analogues resolve to their higher percentiles (Coinpaper and a complementary piece at CoinTribune). Those pieces are useful reminders that history often shows momentum when the macro and onchain backdrop align.
Strengths of these price models
- Simplicity and transparency: They’re easy to backtest and communicate.
- Empirical intuition: When conditions reoccur, history gives a practical baseline.
- Useful as priors: They provide a quantitative prior for Bayesian updates.
But usefulness is not the same as certainty.
The limitations: lookback bias, regime shifts, and overfitting
These models are vulnerable to several statistical and practical failure modes:
- Lookback bias: Selecting a historical window that best fits the present inflates success rates. The more you search, the more you find spurious patterns.
- Survivorship and selection bias: Markets that survived previous shocks may not be representative of future dynamics.
- Regime shift risk: Structural changes in liquidity, market participants (e.g., more institutional flow), macro correlation, or new regulatory regimes can make past analogues irrelevant.
- Model overfitting: Adding many conditioning variables and tuning them to maximize historical accuracy reduces out‑of‑sample reliability.
When facing an 88% headline probability, ask: what was the set of failed instances? How sensitive is the probability to including or excluding single cycles? A robust approach reports a confidence band, not a point estimate, and includes out‑of‑sample validation and walk‑forward tests.
Why the 200‑week EMA matters: technical significance and psychology
The 200‑week Exponential Moving Average is a long‑term trend filter; it smooths price over ~4 years and acts as a widely watched support in multi‑year bull markets. Technical analysts argue a breach of this level often coincides with panic selling and structural deleveraging; some have warned explicitly of a 2018‑style crash if it breaks (Crypto.news).
Why it matters:
- Market memory: Large funds and retail participants monitor weekly levels; breaking them changes narrative.
- Liquidity cliffs: Stop clusters close to long-term averages can cascade as automated and manual stop-losses execute.
- Behavioral feedback: A breach can transform a corrective drawdown into systemic fear, prompting deleveraging across correlated assets.
But technical levels are not fate. The 200‑week EMA can be pierced and reclaimed; the timing and accompanying macro backdrop determine whether a break is a transient shakeout or the start of a protracted capitulation.
Macro amplifiers: how tariffs, geopolitics and policy turn tails into storms
Statistical and technical signals operate inside a macro envelope. Tariffs, sudden interest rate re-pricings, banking stress, or geopolitical shocks can both widen volatility and change correlations. Analysts who warn about deep corrections often point to how non‑crypto shocks exacerbate a technical break. For instance, a liquidity shock concurrent with a 200‑week EMA breach raises the odds of a 30–60% drawdown, an outcome some technical calls are forecasting and others modelers consider low probability (CryptoPotato).
Macro risks matter because they can produce regime shifts: the statistical distribution governing returns can change fast — higher volatility, fatter tails, and different autocorrelation structures. That’s why risk officers should insist on stress tests that combine technical breaks with macro shocks rather than analyzing signals in isolation.
A practical framework to reconcile competing views
Below is a step‑by‑step framework for active traders and risk officers to weigh an 88% historical forecast against a technical catastrophe warning.
- Quantify model confidence
- Turn the 88% headline into a probability band. Use bootstrapping and remove each historical cycle in turn to see sensitivity. Report a 60–95% confidence interval rather than a single number.
- Translate historical analogues into conditional return distributions (not just point targets). What’s the median, 75th, and 10th percentile outcome in the model?
- Map technical triggers and conditional outcomes
- Identify the 200‑week EMA level and define clear regimes: above, within a sandwiched tolerance band (e.g., ±3%), and broken.
- For each regime, quantify conditional volatility (realized vol over the next 30–180 days historically) and worst‑case drawdown.
- Build macro scenarios
- Create a small set of macro paths: baseline (no shock), adverse (policy surprise or tariff escalation), and severe shock (banking stress / systemic liquidity event).
- For each path, estimate how model probabilities and technical outcomes would change. For instance, in a severe shock, historical 88% probability might compress toward 50% or lower.
- Size positions with volatility‑aware rules
- Use volatility parity or Kelly‑informed fractions capped by a risk budget. Example rule: allocate the model‑implied position size scaled by (model confidence × probability of no‑shock) and capped by a maximum drawdown tolerance.
- If the model suggests a high allocation but a technical break is near, reduce size proportionally to the proximity of the price to the 200‑week EMA and raise cash reserves.
- Use layered execution and stop frameworks
- Layer entries over time (dollar‑cost averaging or volatility‑weighted entries) rather than one‑shot exposure.
- Define multi‑threshold stops: an early soft hedge (options collar or reduced leverage) within the tolerance band, and a stronger hedge allocation if the 200‑week EMA is decisively broken.
- Monitor and adapt
- Recompute the model probability and confidence band weekly; track realized vs. predicted outcomes.
- If realized volatility or cross‑asset correlation rises beyond predefined thresholds, automatically reduce risk exposure.
Example sizing worksheet (illustrative)
Assumptions:
- Risk budget: max 8% portfolio drawdown to BTC stress scenario.
- Model median outcome: bullish; model confidence (bootstrapped) = 0.80 (80%).
- Probability of macro shock in next 6 months = 15% (subjective stress input).
- Proximity multiplier: price currently 5% above 200‑week EMA → proximity factor 0.7 (1.0 at comfortable distance, 0.5 when within ±2%).
Allocation step:
- Raw suggested allocation from model = 6% portfolio.
- Adjusted for confidence and macro risk: 6% × 0.80 × (1 − 0.15) = 4.08%.
- Apply proximity multiplier: 4.08% × 0.7 = 2.86% final allocation.
Add tactical overlays: buy put protection sized to cap loss to the 8% drawdown target or use a trailing hedge to expand if the price falls toward the EMA.
Operational tactics: tools to implement the plan
- Options: use collars or long puts to cap tail losses if cost is acceptable. This converts model uncertainty into defined-cost insurance.
- Dynamic leverage: allow leverage only if implied volatility is below a threshold and the 200‑week EMA is intact.
- Stress testing: perform Monte Carlo runs that mix the model's empirical return distribution with regime‑shift shocks (larger sigma draws) to see portfolio P&L under combined stress.
Platforms like Bitlet.app can be part of an execution and hedging toolkit, but the platform choice should follow a clear risk playbook and not be the reason to deviate from your sizing rules.
Decision rules you can adopt today
- Treat the 88% as a prior, not a guarantee. Convert it into a probability band and blend with scenario‑based adjustments.
- Respect the 200‑week EMA as a structural stop reference; tighten hedges and reduce leverage as price approaches and crosses the band.
- Always stress test models with macro shock overlays — tariffs, geopolitics, or policy shocks can turn low‑probability tails into realized events quickly.
- Use layered execution and options to buy time and cap tail losses rather than betting everything on a single forecast.
Final thoughts: probabilistic humility beats binary certainty
No single signal should dominate risk decisions. The 88% model gives a useful prior and optimism; the 200‑week EMA warning reminds us that technical breaks can morph into systemic deleveraging if compounded by macro shocks. Active traders and risk officers win by combining the two: quantify model confidence, map technical thresholds, add macro scenarios, and size positions with volatility‑aware rules and hedges.
Put simply: trust models for ideas, respect technical levels for risk control, and always ask "what macro shock could invalidate both?" — then size for that outcome.
Sources
- https://coinpaper.com/14837/btc-price-model-flags-88-chance-of-rally-to-122-k-within-10-months?utm_source=snapi
- https://www.cointribune.com/en/bitcoin-at-88-chance-to-end-the-year-higher/?utm_source=snapi
- https://crypto.news/bitcoin-risks-2018-style-crash-if-200-week-ema-breaks-warns-analyst/
- https://cryptopotato.com/bitcoin-price-prediction-is-a-deeper-correction-to-60k-incoming-next-for-btc/