Can NFT Demand Support ETH? NFT Sales Rebound, Exchange Outflows & Wallet Growth
Summary
Why the recent NFT rebound matters for ETH
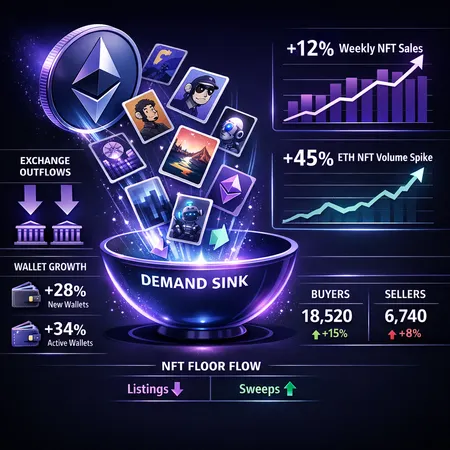
The NFT market is showing signs of life: one industry report found NFT sales rose 12% week-over-week, and Ethereum-backed NFT volume jumped 45% over the same period. That spike is important because most NFT activity still settles in ETH, so increased buying can translate directly into currency demand, fee generation and — through EIP-1559 — token burns that remove supply.
For collectors and investors, Ethereum is the primary settlement layer for many blue-chip and mid-cap NFT projects. When NFT market activity accelerates, it creates more on-chain ETH flow: buyers move ETH off exchanges, transact, and pay gas. But raw sales data alone doesn’t prove a structural change — you need to read it alongside exchange and wallet flows to see whether activity represents short-term excitement or persistent accumulation.
Exchange outflows and wallet-growth: signs of accumulation
Exchange netflows offer one of the clearest windows into whether participants are moving ETH to custody or into spending wallets. Recent reporting shows large ETH exchange outflows that some analysts interpret as accumulation rather than immediate selling. Those outflows reduce liquid exchange inventories and can tighten available supply to traders, which is bullish if demand holds.
At the same time, on-chain address metrics show wallet growth across networks and coins — not just in headline tickers but in the number of addresses holding non-trivial balances. Comparative on-chain studies illustrate how holder distribution differs between protocols, which matters when estimating who is likely to sell versus hold. Higher wallet growth and increasing numbers of small-to-medium balances often indicate a larger retail base that may participate in NFT markets or long-term accumulation by the numbers data shows how holder distribution compares across coins.
Putting those pieces together: rising wallet counts plus ETH leaving exchanges is consistent with accumulation. If those wallets then use ETH to buy NFTs, the ETH flow shifts from exchange liquidity pools into collectible markets and third-party wallets — a migration that can reduce sell-side pressure.
How NFTs act as a demand sink for ETH (mechanics and limits)
NFT purchases consume ETH directly. Buyers transfer ETH to sellers, pay gas fees that are partially burned under EIP-1559, and sometimes lock value in smart contracts or custodial platforms. That sequence creates three distinct demand channels:
- Direct purchase demand: collectors converting fiat or other crypto into ETH to buy NFTs.
- Fee-driven burns: the base fee portion of gas is burned, creating an explicit supply reduction tied to on-chain activity.
- Off-exchange migration: ETH used for NFTs often moves off exchanges and into non-custodial wallets or project treasuries, reducing liquid supply available to sellers.
All three channels matter. A sustained NFT market with high sales volumes will raise fee-related burns and shift ETH off exchanges; together these effects can be a net demand sink. However, the scale matters. Even a significant weekly spike in NFT volume becomes meaningful for ETH price only if it persists and represents a material share of the netflow balance relative to macro liquidity and staking dynamics.
What to monitor: buyer counts, seller counts, floor flows and more
If you want to judge whether NFTs will materially support ETH price, track the following indicators in tandem rather than in isolation:
Buyer counts vs seller counts: Rising unique buyers with flat or falling unique sellers implies demand outpacing supply in the NFT market. Watch marketplace-level metrics and collections’ buyer distribution.
NFT floor flows: Monitor ETH moving to/from floor-priced NFT contracts. Large, consistent floor buys can indicate sustained collector interest and capital entering the ecosystem rather than rotating between collectibles.
ETH exchange netflows: Persistent outflows indicate accumulation. Short, volatile outflows followed by inflows are less convincing. The recent reporting on exchange outflows helps frame whether current movements are accumulation-driven or fleeting (NewsBTC coverage highlights notable ETH exchange netflows).
Wallet growth and concentration: More wallets with ETH holdings (particularly non-exchange wallets) and a decline in concentration among top holders reduce the risk of large, centralized sell pressure. The address-level comparisons in on-chain research give context for whether growth is retail-led or whale-led (see comparative address metrics).
Marketplace liquidity and listings: A falling number of listings at the floor with sustained sales velocity tends to support floor prices and suggests demand that could pull ETH into NFT treasuries or cold wallets.
Fee burn volumes: Track weekly base-fee burns tied to NFT activity. Higher burns are a direct, measurable supply reduction.
No single metric proves causation. The narrative becomes credible when buyer counts and wallet growth rise, exchange supply tightens, NFT floor flows show accumulation, and fee burns are elevated across several weeks.
Interpreting different scenarios
If NFT sales surge but exchange balances remain steady or increase, much of the buying may be financed by traders rotating funds on-exchange — the net supply effect on ETH is muted.
If NFT activity coincides with sustained exchange outflows and wallet-growth concentrated in a wide base of new collectors, the demand-sink thesis strengthens. That pattern suggests ETH is being moved off-exchange and into collectible holdings or personal custody.
If volume spikes are short-lived and quickly reversed, the impact on ETH price will be limited and likely ephemeral.
Practical takeaways for collectors, analysts and ETH investors
Treat NFT sales numbers (for example, the recent 12% rise and 45% Ethereum NFT volume spike reported in market coverage) as one input — valuable, but not sufficient on their own to predict ETH price moves (industry report on NFT sales rise).
Combine NFT metrics with exchange netflow and wallet-growth data. Persistent exchange outflows coupled with growing buyer counts are the strongest signal that NFTs are shifting from hobby markets into a structural demand sink for ETH.
Monitor fee-burn trends and staking dynamics alongside NFT flows; both affect circulating supply. Platforms like Bitlet.app that provide trading and custody can make it easier to track how liquidity is moving for retail participants, but the core analysis remains on-chain flows and market structure.
Keep timeframe in mind: short-term spikes can create trading opportunities, but only sustained behavioral shifts from sellers to holders will likely have lasting price implications for ETH.