STX’s 23% Rally: On‑Chain Psychology, Snapback Risk, and a Practical Trading Checklist
Summary
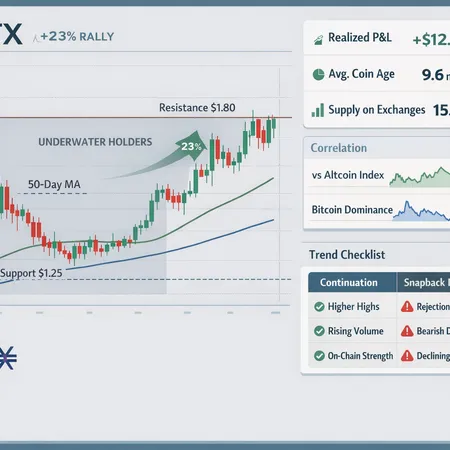
Quick framing: what happened and why it matters
In a short window STX jumped roughly 23%, a move that caught swing traders’ attention and drew rapid coverage. Buyers stepped in for a few interlocking reasons: short-term accumulation visible on-chain, a market-wide lift that carried many altcoins higher, and a narrative-driven bounce around Stacks-specific catalysts. But the move also came with a caveat — sizable portions of the supply remain underwater, which can translate into potent snapback pressure if price action turns ugly (a dynamic highlighted in reporting on the rally).
Context is critical: the rally didn’t happen in isolation. Broad crypto markets extended gains around the same time, while Bitcoin dominance has been creeping higher and altcoins overall remain fragile. That mix makes STX a high-beta play: it can rally fast, but reversal risk is equally amplified.
Short‑term psychology: who bought and why
Short-term price surges often reflect a few psychological dynamics:
- FOMO from momentum traders. When a token breaks a short consolidation with volume, algos and momentum traders pile in, producing quick upside.
- Dip buyers hunting a structural narrative. Some participants stepped in because they view Stacks as a long-term ecosystem play and took the rally as an opportunity to add exposure.
- Profit‑taking and stop triggers for earlier buyers. Those who bought the local highs — the underwater holders — represent a latent supply that can flip to active selling if price revisits or briefly exceeds their breakeven.
AmbCrypto’s coverage of the rally stresses this last point: the presence of underwater holders can meaningfully increase the probability of a snapback once price approaches those breakeven bands. That’s not a prediction of imminent collapse — but a reminder that rallies funded by marginal buyers often have limited follow-through.
On‑chain mechanics to watch (what to monitor and why)
Below are the on‑chain metrics that provide the clearest early read on whether the STX move is structurally healthy or just a short squeeze.
Realized P&L / Unrealized Profit & Loss
- What it tells you: how much of the circulating supply is sitting in profit versus loss, and whether recent buyers are already in the green.
- How to use it: a sudden rise in realized profit (many coins moved into profit and possibly spent) often precedes a pullback; conversely, accumulation while unrealized losses persist suggests room for further compression and upside.
Coin age and coin‑age compression
- What it tells you: coin age measures how long tokens have been idle. A drop in average coin age or a spike in coin‑days destroyed indicates dormant supply moving.
- How to use it: coin-age compression (older coins moving into circulation) alongside rising price can be bullish if it represents deliberate accumulation from long-term holders; but if those coins are then traded on exchanges, it becomes sell-side pressure.
Supply on exchanges and inflows/outflows
- What it tells you: the raw liquidity available to be sold quickly. Rising exchange balances typically increase downside risk.
- How to use it: track net flows: a sustained decline in exchange supply during a price rise is a healthy sign; a bounce in exchange inflows during the rally is a red flag.
Active addresses, transfer volumes, and concentration
- What it tells you: whether the rally is broad-based (many wallets transacting) or dominated by a handful of whales.
- How to use it: higher active-address metrics combined with rising volume points to real demand; if concentration metrics spike, a single large wallet can reverse price by dumping.
Practical note: combine these on‑chain reads with exchange order-book behavior and derivatives open interest where available. That gives a fuller picture of liquidity and forced-liquidation vectors.
How the broader market shaped the move
STX’s jump rode a wave of gains across crypto that extended multiple days, as market snapshots showed broad performance extending gains for a fifth straight day. That means some of STX’s move was momentum carry from the larger market.
At the same time, Bitcoin dominance has been climbing while many altcoins lag near multi‑year lows. A rising dominance backdrop raises the bar for altcoin follow‑through: altcoins must clear relative resistance to attract fresh capital, otherwise rallies can be short-lived and subject to rotation back into BTC.
Put another way: a healthy STX continuation requires either (a) renewed inflows into altcoins generally, or (b) a Stacks-specific liquidity re‑rating that decouples it from the altcoin cohort.
Technical levels and a practical confirmation checklist
Rather than giving hard price targets (which age quickly), use the following technical framework to judge whether the rally is likely to continue or snap back.
Technical confirmations to watch (bullish):
- Price holds above the breakout level with a clean retest (previous resistance becomes support).
- Volume on the breakout and retest is at least in-line with the breakout volume (no volume drop‑off).
- Short-term EMAs (21/50) have crossed or are curling upward and price is trading above them.
- Exchange supply is falling or flat during the move; coin age shows controlled distribution rather than mass exits.
- Momentum indicators (e.g., RSI) are not diverging negatively; realized P&L shows shrinking unrealized losses rather than a spike in realized profit.
Technical/behavioral red flags (snapback risk):
- A rapid increase in supply on exchanges immediately after the move.
- Large realized profits among recent buyers (they may begin taking gains quickly).
- Price spikes on thin volume (a classic short-squeeze signature) followed by heavy wick rejection.
- Bitcoin dominance significantly accelerates higher while altcoin breadth weakens, pulling capital away.
- A few wallets dramatically increasing outgoing transfers to exchanges (concentration sell signal).
A concise checklist for traders and allocators
Green signals (trend continuation likely):
- Breakout + retest holds above breakout, volume supports price.
- Exchange balances trending down; coin age shows healthy accumulation.
- Macro: BTC stable or consolidating, altcoin breadth improving.
Red signals (snapback elevated):
- Exchange inflows spike; large realized profit band forms near current price.
- Price action shows long upper wicks or fails multiple retest levels.
- BTC dominance surges while altcoin breadth collapses.
If you get a mix of signals, reduce position size and prefer staggered scaling (add only on confirmed green signals).
Practical risk management rules for STX volatility
For both swing traders and portfolio managers, discipline beats prediction. Practical rules:
- Position sizing: risk no more than a small fixed percentage of capital on a single STX trade (e.g., 1–2% of portfolio equity per swing, adjusted for total volatility exposure across altcoins).
- Use defined exits: set logical stop-losses under the retest level or under a volatility-adjusted threshold; avoid psychological stops tied to round numbers.
- Scale in/out: enter in tranches rather than all at once; take partial profits at predetermined milestones and move stops to breakeven.
- Hedge tactically: where available, use inverse correlation instruments or options to protect large directional bets (especially when on‑chain shows many underwater holders who could trigger sudden selling).
- Watch leverage and liquidity: during fast rallies, leverage amplifies snapbacks; reduce leveraged exposure when exchange inflows rise or realized profits spike.
A simple rule of thumb: as realized profits across the supply concentrate near current price, tighten stops and reduce position size — the reward potential falls while forced-sell risk increases.
Putting it together: a decision flow for STX
- Check market context: is BTC dominance rising fast? If yes, require stronger on‑chain proofs for an add.
- Read on‑chain: are exchange balances falling and coin age compressing from long-term holders (healthy)?
- Validate technically: did price retest and hold breakout on volume?
- Size and protect: if steps 1–3 are green, add in tranches with a tight stop; otherwise wait for clearer signals or hedge existing exposure.
- Monitor live: keep an eye on sudden exchange inflows, whale transfers, and realized P&L shifts — these change the risk profile faster than most technicals.
Final takeaways for swing traders and allocators
- STX’s 23% rally was a mixture of market momentum and on‑chain accumulation, but latent supply from underwater holders raises legitimate snapback risk (as noted in reporting on the move).
- The best trading edge comes from blending on‑chain metrics (realized P&L, coin age, exchange supply) with price structure and macro context (altcoin breadth and BTC dominance).
- Use a checklist approach: require at least two on‑chain confirmations plus a clean technical retest before adding size; always size and hedge with explicit stop rules.
For allocators using platforms like Bitlet.app or anyone managing a concentrated altcoin sleeve, the same rules apply: favor measured entries, watch on‑chain health, and expect rapid regime shifts — STX can rally hard, and it can snap back just as quickly. Trade the data, not the noise.
Sources
- AMB Crypto report on STX rally and snapback warning
- CryptoTicker market snapshot of broad crypto gains
- Crypto.news analysis on rising Bitcoin dominance and altcoin lag
For many traders, Stacks remains a high‑beta altcoin to watch, and that matters especially when Bitcoin dominance is shifting the market's risk appetite.