Why Ethereum Open Interest Is Falling While Whales Accumulate: A Practical Deep-Dive
Summary
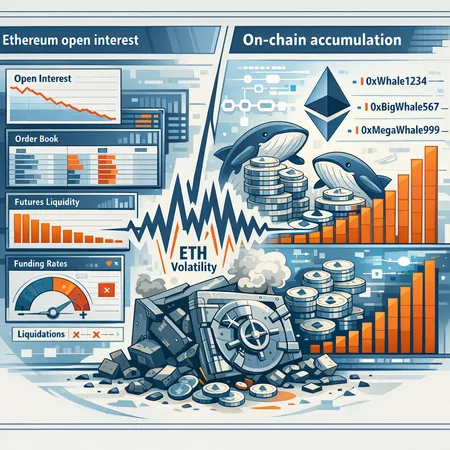
The apparent paradox: falling open interest vs. rising on‑chain accumulation
Over the past weeks, data feeds told two different stories about ETH. Aggregate futures open interest on major exchanges declined — a signal often interpreted as fading leverage and lower derivatives-driven risk. At the same time, on-chain metrics showed large addresses quietly adding ETH to custody, suggesting accumulation beneath the surface.
This isn’t a contradiction so much as a mismatch of scope. Open interest reflects activity in the derivatives world; on-chain accumulation captures custody changes and long-term holder behavior. Each measures a different layer of market structure and therefore can move in opposite directions for rational reasons.
For many practitioners and analysts, reconciling these layers is essential. Below we walk through what each signal measures, the mechanics that make divergence possible, how funding rates and liquidations shape volatility, and what large treasury actions — like the Ethzilla liquidation event — mean for perceived supply. We close with a checklist traders and holders can use to parse the signals.
What open interest and on‑chain accumulation actually measure
Open interest: leverage, bets, and counterparty exposure
Open interest (OI) is the total number of outstanding derivative contracts (futures or perpetuals) that have not been settled. It’s a measure of leverage and exposure: rising OI usually means more new positions are being created — longs, shorts, or both — and more potential for liquidation cascades. When OI falls, it indicates positions are being closed or net exposure is shrinking.
NewsBTC’s recent coverage highlighted a multi-exchange drop in Ethereum open interest, signaling less on-exchange derivatives activity and lower immediate counterparty exposure source.
On‑chain accumulation: custody, intent, and supply dynamics
On‑chain accumulation looks at actual ETH moving into long-term wallets, staking, or cold storage — essentially a shift in supply that’s harder to redeploy quickly. On-chain metrics that matter include large transfers to non-exchange addresses, growth of whale balance, staking inflows, and falling exchange reserves.
Cryptonews highlighted on-chain indicators suggesting that large holders — “whales” — were adding to positions even while price action looked muted, a sign of quiet accumulation beneath the headlines source.
Why derivatives activity can fall while long-term holders buy
There are several mechanisms that explain the divergence.
Different time horizons: Derivatives traders often target short-term leverage and intraday to weekly moves. Long-term holders buy for months or years. If macro uncertainty rises, shorts may be closed and OI shrinks, while patient whales accumulate on dips.
Risk-off among levered players: Rising volatility or uncertain catalysts can prompt margin-conscious traders to reduce position sizes, pull liquidity, or shift to cash, lowering OI even as spot buying persists.
Migration of flow to OTC and custody solutions: Institutional buyers may prefer over-the-counter (OTC) buying or custody platforms rather than exchange-traded futures. That reduces visible exchange OI but increases off-exchange demand for spot ETH.
Staking and long-term custody: As ETH moves into staking or custodial vaults, it exits the immediate supply available for quick trading — a net positive for holders — while futures desks may reduce hedged positions.
Market makers and hedging: Liquidity providers can tighten futures volumes when their risk models detect adverse skews or poor spreads, leading to lower OI despite steady spot flows.
These dynamics mean that falling futures OI does not automatically equal waning demand for ETH. It can reflect deleveraging while structural demand — accumulation by whales or staking inflows — increases.
Funding rates, liquidations, and ETH volatility
Funding rates: the heartbeat of perpetuals
Perpetual swap funding rates align perpetual prices with spot. Positive funding means longs pay shorts (demand for long leverage); negative funding means short demand. Funding extremes reveal speculative positioning and are a proxy for crowd bias.
When funding is consistently positive and large, the market is long and precariously dependent on liquidations to move price rapidly. Conversely, a neutral or slightly negative funding regime often accompanies falling OI and lower immediate liquidation risk.
Liquidations: amplifier or non-event?
High OI + concentrated leverage = potential for cascading liquidations and sharp volatility. If OI falls, the immediate fuel for these cascades is reduced — price moves can be less violent because there are fewer forced sellers or buyers de-leveraging.
But low OI doesn’t eliminate volatility. Big spot sells (treasury liquidations, exchange inflows, or a sudden macro shock) can still produce sharp moves if on-exchange liquidity is thin.
Putting it together
So what does a falling OI with rising on‑chain accumulation imply for volatility? Typically: lower derivatives-driven, short‑term liquidation risk — and a market more influenced by spot flows and inventory shifts. That can mean calmer chop or, paradoxically, sharp moves when a large spot seller or buyer acts in a thin market.
Treasury moves and corporate liquidations: the Ethzilla example
Corporate treasury events can reshape perceived supply quickly. Ethzilla’s reported liquidation — a sizable sell to liquidate staking or treasury holdings and a subsequent redeployment into non-ETH assets — is a case in point. Such moves are noisy: they add temporary sell pressure, but the capital often lands somewhere else (capital gains, buybacks, or reinvestment into tokenized real-world assets) that influences net long-term demand.
Blockonomi reported on Ethzilla liquidating over $114.5M in ETH and then redeploying capital (e.g., buying expensive physical assets), illustrating how corporate liquidity actions can remove ETH from trading pools or increase exchange supply during the sale window source.
The takeaway: corporate liquidations are often one-off supply shocks visible in exchange inflows and short-term price action. But they don’t necessarily change the underlying holder base if proceeds are redeployed into other long-term assets or reduce circulating float via buybacks or staking.
What this means for ETH price risk and entry points
For intermediate traders and on‑chain analysts, here’s how to translate the divergence into actionable thinking:
Lower immediate liquidation risk: Falling OI generally means derivatives-driven blow-ups are less likely. Traders who scalp funding or rely on quick forced moves should adjust position sizing.
Watch where accumulation is happening: If whales are moving ETH into staking or cold wallets, available tradeable supply tightens — a structural bullish input that plays out over weeks or months.
Active treasury sales can still spike volatility: A watched liquidation event (Ethzilla-style) can cause short-term drawdowns even if OI is low; the market may not absorb a large sale efficiently.
Entry framing: For swing traders, look for OI to stabilize or reaccumulate in tandem with neutralizing funding rates before taking leveraged longs. For longer-term buyers, dollar-cost average into on-chain accumulation dips while monitoring exchange reserve trends.
A practical checklist: signals traders and long-term holders should watch
Use this checklist to triangulate risk and timing.
- Exchange futures open interest: rising OI + positive funding may warn of crowded long risk; falling OI reduces immediate liquidation risk.
- Aggregate funding rates: sustained large positives or negatives reveal crowd bias — extremes often precede mean reversion.
- Exchange ETH balances: spikes in inbound flows often precede selling pressure; falling reserves suggest tightening supply.
- Whale transfers and non‑exchange accumulation: large transfers to cold wallets or staking addresses imply structural demand.
- Staking inflows and withdrawals: increasing staking reduces liquid float; withdrawals from custody can reintroduce supply.
- Options skew and IV: rising put demand or higher skew indicates hedging and downside protection being bought.
- Reported treasury actions / corporate liquidations: monitor on-chain labels and on-exchange deposit flags (e.g., Ethzilla-style events). Blockonomi’s coverage provides a useful narrative example source.
- OTC and custody flows: institutions may buy off-exchange — look for reported OTC prints and custody inflows rather than exchange tickets.
- Macro and stablecoin flows: increasing stablecoin minting and transfers to exchanges can presage buying; stablecoin outflows can imply cash leaving markets.
Practical trade and hodl rules of thumb
- If you are a leveraged trader: reduce size when funding spikes and OI is high; prefer trades when funding neutralizes and OI rebuilds sustainably.
- If you’re a swing trader: prefer entries when on-chain accumulation aligns with stabilized OI and benign funding rates. Use options or stops to limit tail risk.
- If you’re a long-term holder: DCA into accumulation while diversifying entry points; consider staking some ETH to remove it from liquid float but keep an allocation for rebalancing.
Platforms like Bitlet.app illustrate how non-levered products (installments, earn) can be useful for gradual accumulation while avoiding derivatives exposure.
Final synthesis
A fall in exchange open interest alongside rising on‑chain accumulation is not a paradox if you remember each metric answers a different question: OI answers “how much leverage/derivative exposure is active?” while on‑chain accumulation answers “how much ETH is being taken out of circulation by holders?” Together they form a richer market map.
Lower OI can mean calmer, less liquidation-prone markets in the near term. Rising whale accumulation can tighten effective supply and act as a structural bullish force — but one-off treasury liquidations (like Ethzilla’s) and thin spot liquidity can still produce sharp, short-term volatility.
Watch the checklist above to triangulate between derivatives and spot signals before sizing positions. With these tools, traders and on-chain analysts can make better entry and risk decisions in a market where different layers often tell different stories.
Sources
- Ethereum open interest declines across exchanges — NewsBTC
- On-chain data shows whales quietly accumulate as price stalls — CryptoNews
- Ethzilla liquidation and redeployment coverage — Blockonomi
For readers tracking these metrics in real time, combine exchange OI and funding dashboards with on-chain analytics and keep an eye on labeled treasury flows — that blend of data will give you the clearest read on ETH volatility and risk.


