Bitcoin: Spot-Led Rally Ahead or Prone to Cascading Liquidations?
Summary
Quick take
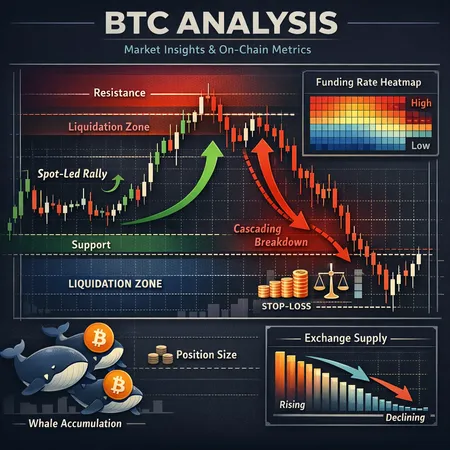
Bitcoin's latest price moves look like a tug-of-war between accumulation on spot chains and compressed derivatives fragility. On one hand, exchange supply is near multi-year lows while on-chain whales continue to accumulate — a classic setup for a spot-led rally if flows pick up. On the other hand, derivatives positioning and funding-rate behavior show elevated risk that could turn a correction into a fast, cascading sell-off.
For many traders, Bitcoin remains the primary market bellwether; reading both the spot and derivatives desks together gives a clearer probability picture than watching price candles alone.
Market snapshot: price, supply and context
Recent intraday moves pushed BTC below the $92k mark before buyers stepped in, a reminder that technical levels still matter even amid on-chain structural changes. Price action has been choppy, but underlying supply metrics have shifted materially: exchange reserves are down to multi-year lows, while a number of large addresses continue to accumulate.
Those two facts — scarce exchange liquidity and whale accumulation — are constructive for sustained rallies because fewer available coins on exchanges mean less immediate selling pressure when demand spikes. Crypto press coverage and on-chain trackers have flagged both the exchange supply drop and increased whale accumulation as notable market signals (see the coinpedia analysis on exchange supply). At the same time, short-term technical levels near $92k are acting as a psychological battleground referenced in market updates.
Short-term liquidation risk: why derivatives can amplify a correction
The derivatives market can accelerate moves beyond what spot supply/demand alone would produce. When positions are crowded and concentrated — especially across perpetual futures and levered longs — a relatively small price move can trigger cascading liquidations. Analysts have warned that technical imbalances in futures (open interest stacked on one side) could put over $10B at risk in the event of a decisive breakdown, creating a feedback loop of forced selling and further price weakness.
Practical implication: even with favorable on-chain fundamentals, derivatives overhang can turn a routine pullback into a violent move. Traders need to identify likely liquidation clusters (price ranges with concentrated levered positions) and avoid being on the wrong side of that squeeze.
Funding-rate dynamics: what rising funding means
Perpetual funding rates are a live thermometer of derivative market stress. When funding turns significantly positive, longs pay shorts — a signal that market participants are biased long and that the structure is ripe for a short squeeze (or for long liquidation if price reverses). Glassnode-based analysis and market coverage have tracked rising funding rates recently, indicating growing longs pressure on perpetuals.
Rising funding rates are a double-edged sword. They help sustain rallies when buyers keep paying funding to stay long, but they also make the long side expensive and fragile: any sudden sentiment shift can quickly unwind levered longs and cascade. For traders, watching the magnitude and persistence of funding — not just its sign — is crucial. A sustained high positive funding that coincides with thinning exchange supply and a large spot buy flow is the most bullish convergence; high funding with growing open interest and no fresh spot demand is more precarious.
Exchange supply and whale accumulation: the spot-floor narrative
Exchange supply is one of the clearest on-chain indicators of potential selling pressure. Multiple on-chain reports show exchange reserves at levels not seen in several years while large addresses have continued to accumulate. That combination suggests two things: available liquidity to sell is lower, and large players may be positioning for higher prices or longer-term hodling.
If spot buyers (institutions, ETFs, or large whales) begin moving significant fiat into the market, the limited exchange float can accelerate upward moves — a classic spot-led rally dynamic. However, accumulation by whales can also be stealthy reserve building that becomes a source of volatility if those same whales decide to rebalance in a hurry.
Scenario-driven trade ideas (actionable)
Below are scenario outlines with the market cues that would make each one more likely, and specific trade ideas for intermediate traders.
Bull case — Spot-led rally (base case if spot flows resume)
- Conditions that confirm: continued exchange outflows, persistent whale accumulation, and fresh spot buying (institutional flows/ETF inflows) that coincides with high but stable positive funding.
- Key levels: a sustained reclaim and hold above ~$96–100k would increase odds of a multi-week leg higher; strong resistance sits roughly between ~$100–110k depending on momentum.
- Trade ideas: consider scaling into long exposure on a clean daily close above ~$96k with a tight initial stop (e.g., 3–5% below entry), pyramiding on pullbacks; use moderate leverage (≤2x) or spot exposure to avoid liquidation risk.
- Optional hedge: small put spread that cushions a 10–20% drawdown while keeping upside exposure.
Bear case — Cascading breakdown (derivatives-driven)
- Conditions that confirm: sharp drop through $92k with clustered liquidations, funding flips or remains elevated while price falls, and a sudden spike in exchange inflows.
- Key levels: failure to hold ~$88–92k opens room toward lower liquidity bands; a clear break and daily close below ~$88k would likely accelerate deleveraging.
- Trade ideas: keep short exposure limited and time-based (fade rallies into the breakdown), or trade protective puts; avoid adding leverage on the long side until funding normalizes and exchange inflows subside.
- Risk control: use OTM (out-of-the-money) protective options to hedge concentrated long bets rather than large leveraged short positions.
Neutral / range-bound
- Conditions that confirm: funding rates moderate, exchange flows slow, and price oscillates between ~$88–96k.
- Trade ideas: volatility-selling strategies (iron condors / short strangles with strict risk limits), small directional trades sized to withstand whipsaws, and harvest funding via lending or short-duration yield products.
Risk management checklist for intermediate traders
- Position sizing: limit any one directional trade to a small percentage of portfolio (e.g., 1–3%), especially when funding rates are elevated.
- Leverage caps: keep leverage modest (≤2–3x spot-equivalent for most retail/intermediate traders). Remember that liquidation risk grows non-linearly with leverage.
- Stop methodology: prefer cash stops on exchanges with good execution or options-based hedges; avoid market stops during low-liquidity periods.
- Monitor three live metrics: funding rates (magnitude and sign), exchange inflows/outflows, and concentrated open interest clusters (where liquidations would cluster). These are leading indicators that precede violent moves.
- Event triggers: watch macro events (rates, CPI), scheduled ETF settlements/flows, and major exchange outages or filings. Any of these can flip the odds quickly.
Practical note: tools like Bitlet.app can help traders dollar-cost-average or deploy installment buys to reduce timing risk in a high-volatility environment, but they do not eliminate the need for active risk management.
Putting it together: probability-weighted view
Right now, the probability of a spot-led rally has increased relative to six months ago because exchange supply is scarce and whales are accumulating; however, the short-term risk of a derivatives-driven cascade remains non-trivial given elevated funding and concentrated leverage. That combination means the path higher could be quick and choppy — an environment that rewards disciplined sizing, real-time monitoring of funding and flows, and preferencing spot or hedged exposure over large levered bets.
Intermediate traders and on-chain analysts should watch whether fresh spot flows coincide with stable or rising funding (bullish squeeze) or whether funding stays high while price weakens and exchange inflows spike (bearish cascade). Use the scenario triggers and levels above as a checklist rather than a prescriptive trading system.
Conclusion
Bitcoin's current tapestry is mixed: scarce exchange liquidity and whale accumulation lay the groundwork for a sustained rally, but derivatives imbalances and elevated funding signal that a swift breakdown remains possible if sentiment shifts. Successful navigation requires marrying on-chain signals (exchange supply, whale behavior) with derivatives metrics (funding rates, open interest) and disciplined risk controls.
If you're an intermediate trader, prioritize small, well-structured positions, explicit stop/hedge plans, and daily monitoring of funding and flow metrics — those are the inputs that will tell you whether the market is preparing a squeeze or a cascade.