Bitcoin Whales, Satoshi Transfers and the Four‑Year Cycle: A Data‑Driven Playbook
Summary
Why whale narratives move markets
Headlines about giant transfers or multi‑month “whale selling” quickly become narrative drivers. For active traders and on‑chain analysts the key question is not whether a whale moved coins — they move coins all the time — but whether those movements represent real selling pressure that reduces available BTC liquidity and therefore can affect price.
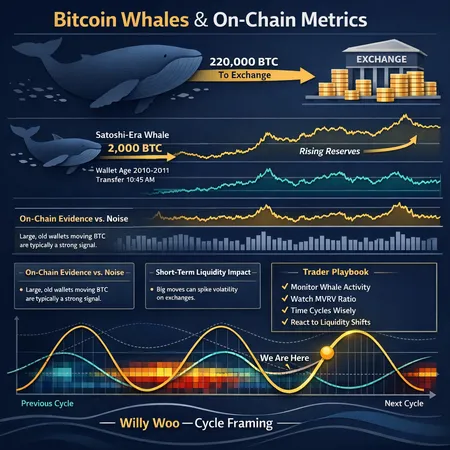
For many traders, Bitcoin remains the primary bellwether, so claims like “220,000 BTC sold by whales in one year” will naturally cause scrutiny. That figure comes from an on‑chain report that aggregates large outflows and wallet movements; the raw number is eye‑catching, but raw sums can be misleading without context. I’ll walk through the metrics and the likely interpretations, then translate that into a practical playbook.
Reading the on‑chain metrics behind large whale selling claims
When an analyst claims a massive volume was “sold,” they generally rely on one or more of these indicators:
- Exchange inflows and outflows: sharp inflows to centralized exchanges (CEX) are the classic proxy for imminent selling. Net exchange inflows over time are useful but noisy.
- Balance changes in top N wallets: large declines in the balance of whale cohorts can indicate distribution, but they can also reflect transfers between cold wallets, OTC desks, or self custody rebalancing.
- Coin age metrics (Coin Days Destroyed, UTXO age distributions): movement of vintage coins lights up these metrics and signals that long‑dormant supply is being activated.
- SOPR / Realized metrics: spent output profit ratio changes show whether coins moved are in profit or loss — a cluster of realized profits after large transfers is stronger evidence of selling.
The 220,000 BTC claim — highlighted in the on‑chain report — bundles large transfers attributed to “whales” over a year. It’s important to ask: were those coins sent to exchanges? Were they sent to known OTC/market makers? Or were they simply shuffled into new cold wallets? Exchange reserve data and labeled address flows are necessary to turn a movement count into a credible selling estimate. The original report is worth reading to see its methodology here.
Common sources of overcounting
- Internal reshuffles: institutional custodians and miners frequently consolidate or rotate funds across addresses.
- Brokered flows: OTC trades often move coins off‑chain or through service wallets, creating large on‑chain movements that aren’t immediate market sells.
- Double counting across time windows: the same coins can be counted multiple times if the dataset buckets by movement events rather than net position change.
The right interpretation combines net changes in exchange reserves with evidence of realized profit (SOPR) and vintage coin activation (Coin Days Destroyed). A headline number without that triangulation is a signal to dig deeper, not a trading call by itself.
Satoshi‑era transfers: rarity, optics, and real market impact
Vintage coins moving — like the recent reportedly 2,000 BTC transfer from a Satoshi‑era miner — always garner outsized attention. The move of long‑dormant UTXOs is covered in market notes (see the U.Today post) and often triggers fear, uncertainty and doubt among retail traders: old coins equal imminent dumping, right? Not necessarily. See the data note here: https://u.today/satoshi-era-whale-wakes-up-to-move-2000-btc?utm_source=snapi
Several points matter:
- Vintage transfers are rare but not unprecedented: older wallets periodically move for estate management, re‑custody, tax planning, or consolidation. Only a subset of vintage movements are associated with sell intent.
- Immediate liquidity impact depends on destination: moving 2,000 BTC to a custodial exchange order book is materially different from a transfer to a cold storage aggregator or an OTC desk wallet.
- Sentiment vs liquidity: even if the coins are not sold, the perception of a Satoshi transfer can amplify volatility because traders react first to headline signals and only later discover the trade details.
In short: a Satoshi‑era transfer is a high‑attention signal. It increases the probability of short‑term volatility and may tighten order book depth, but it is not a deterministic sell event unless you can observe the coins flowing to exchange‑active wallets.
Do classic four‑year cycles still hold? Willy Woo’s take and how to interpret cycles
Willy Woo — one of the more prominent on‑chain analysts — has recently defended the persistence of Bitcoin’s four‑year cycle structure against claims the pattern is dead. His argument (summarized in his discussion) is that halving‑driven supply shocks, adoption curves and macro liquidity dynamics continue to create multi‑year rhythms in price and on‑chain behavior. Read his full defense here: https://news.bitcoin.com/onchain-analyst-willy-woo-defends-bitcoins-four-year-cycle-dismissing-death-of-the-pattern-narratives/
A few caveats when applying cycle logic:
- Cycles are probabilistic, not deterministic: historical halving + adoption dynamics have produced roughly four‑year peaks and troughs, but external shocks and changing market structure can stretch or compress timing.
- Amplitude and timing shift: the cycle can persist in pattern but with variable peak magnitudes and phase lengths. Liquidity growth, ETF flows, and macro liquidity all modulate cycle expression.
- Whale behavior can distort short windows but rarely erases multi‑year trends: large selling over weeks can create corrections, but sustained upward or downward multi‑year trends are driven by structural supply/demand and adoption.
Willy Woo’s position is useful because it reframes headlines: instead of asking whether the cycle is dead after a corrective leg, ask whether the structural drivers (supply changes around halving, adoption, and diminished exchange reserves) remain consistent with multi‑year reaccumulation or distribution.
Short‑term mechanics: how multi‑scale whale movements affect liquidity and sentiment
Whale flows operate at multiple scales with differing market effects:
- Micro (minutes–hours): large market sells create immediate slippage and can cascade liquidations in levered markets. Watch order book depth and funding rates.
- Meso (days–weeks): visible exchange inflows and spikes in realized profit metrics often coincide with multi‑day corrections and shifts in retail sentiment.
- Macro (months–years): long‑range accumulations or distributions by institutions shift available supply and can alter cycle amplitude.
Key liquidity metrics to monitor:
- Exchange reserves: falling reserves suggest constrained sell liquidity; rising reserves are a warning sign.
- Orderbook depth at key levels: onchain transfers only matter when they intersect with marketable liquidity.
- Funding rates and open interest: high positive funding with rising open interest during a whale outflow increases the risk of leveraged unwind.
Sentiment is a force multiplier. A vintage coin transfer can trigger stops and social‑media fear; the mechanical effect may be small, but the behavioral impact can produce outsized short‑term moves.
Trader & analyst playbook: separating noise from signal
Below is a practical checklist for navigating whale‑driven volatility and cycle interpretation.
Triangulate selling with at least two of these: exchange inflows, labeled‑address destination, and SOPR/realized profit spikes. One metric alone is insufficient.
Monitor net exchange reserves daily and intraday during high attention events. A transfer that does not increase exchange balances is less likely to be immediately sold.
Track vintage coin metrics (Coin Days Destroyed, UTXO age bands). Activation alone is a red flag for attention; realized profit metrics determine selling probability.
Watch derivatives: funding rates, open interest, and liquidation clusters. Whales can trigger a short squeeze or long liquidations even without selling into the spot book directly.
Use limit orders and size discipline. When headlines break, order books thin; market orders suffer slippage. Layer orders across levels instead of single large market entries.
Keep a cycle perspective. If macro on‑chain health (declining exchange reserves, rising long‑term holder balances, increasing usage) supports a bullish multi‑year thesis, treat whale headlines as tactical volatility, not strategy‑breaking events.
Prepare contingency hedges for large transfers: short duration options or a small inverse futures hedge can offset extreme intraday moves while preserving long‑term positioning.
Label and track counterparties where possible. Labeled flows to custodians, OTC desks, miners, or known exchanges change interpretation dramatically.
Factor in liquidity slippage cost for order sizing. Calculate expected market impact based on order book depth at your intended execution size.
Document and backtest your reaction rules. Over time you’ll learn which signals historically preceded meaningful price moves in your timeframe.
Practical example: interpreting the 220k and 2k headlines together
Combine the two stories: a report of 220,000 BTC moved by whales over a year and a distinct 2,000 BTC Satoshi‑era transfer. The two are not mutually reinforcing evidence that the market will crash. Large aggregated movement over a year can include many custodial reshuffles and internal flows; a single vintage transfer is more of a volatility catalyst than a proof of distribution.
Good analysts will ask: how much net increase in exchange reserves accompanied those movements? Was SOPR elevated? Did funding spike and open interest surge? Without affirmative answers across those observables, treat the headlines as tactical noise. For reference to those reports, see the on‑chain whale selling note and the Satoshi movement coverage: 220,000 BTC sold claim and Satoshi‑era 2,000 BTC move.
Final takeaways
- Headlines about whale selling or vintage transfers are important signals, but they require triangulation with exchange reserves, profit realization metrics, and labeled address context before you act.
- Satoshi‑era transfers raise the probability of short‑term volatility mostly via sentiment, not because they are deterministic sell events.
- Four‑year cycle frameworks — as defended by analysts like Willy Woo — remain a useful lens, but treat cycles as probabilistic patterns that can stretch or shift in timing and amplitude.
For active traders, the practical edge comes from combining on‑chain signals with market microstructure: watch exchange flows, depth, funding, and vintage coin activation, and use disciplined size, limit orders and hedges when headlines break. Platforms and tools matter — whether you’re monitoring exchange reserves, raw UTXO data, or using execution tools (including services such as Bitlet.app for certain workflows) — but methodology wins over any single dashboard.
Sources
- https://www.cointribune.com/en/220-000-btc-sold-in-one-year-do-bitcoin-whales-anticipate-a-crash/?utm_source=snapi
- https://u.today/satoshi-era-whale-wakes-up-to-move-2000-btc?utm_source=snapi
- https://news.bitcoin.com/onchain-analyst-willy-woo-defends-bitcoins-four-year-cycle-dismissing-death-of-the-pattern-narratives/