Who's Driving Bitcoin's 2026 Move — Long‑Term Holders or Whales?
Summary
Why this debate matters now
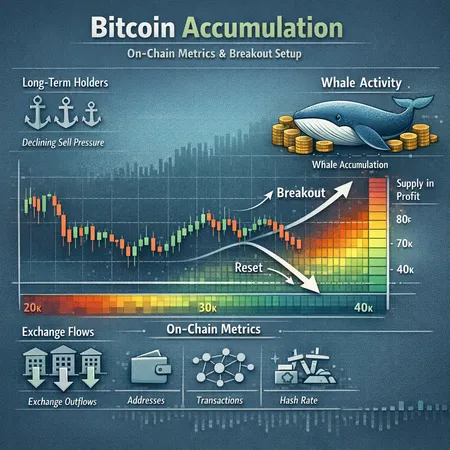
Bitcoin's next major move — whether a breakout toward new highs or a volatile reset — will be shaped by who is actually accumulating. For many market participants, Bitcoin accumulation by long‑term holders (LTHs) signals a durable bid; for others, headlines about whale stacking imply a fragile, concentration‑driven rally. Separating signal from noise matters for position sizing, execution, and institutional allocation decisions as we look toward 2026.
This piece walks through the on‑chain evidence supporting a durable accumulation thesis, the strongest counterarguments that accuse analysts of over‑reading whale activity, and actionable implications for intermediate traders and market analysts. We'll weave technical context into the on‑chain view and finish with a practical checklist you can monitor in real time.
On‑chain signals that favor durable accumulation
Below are the primary on‑chain metrics that proponents cite when arguing that accumulation ahead of 2026 is broad and sustainable.
Exchange flows: net outflows and shrinking exchange liquidity
One of the clearest accumulation signs is persistent net outflows from centralized exchanges. When exchanges lose net BTC supply, realized liquidity shrinks and selling pressure can evaporate. CoinTribune and Coinpaper highlight recent patterns where exchange balances declined, consistent with accumulation by non‑exchange wallets and LTHs (CoinTribune article, Coinpaper chart read).
Why this matters: lower exchange reserves increase the difficulty for quick, large-scale liquidations and tilt the supply/demand balance toward price discovery when demand renews.
Long‑term holder behavior: accumulation vs. distribution
LTH cohorts (coins last moved >155 days in many heuristics) are central to the argument. Indicators showing a pause or decline in realized LTH selling — together with net position growth among older cohorts — suggest holders are choosing to keep coins off market. CoinTribune makes this case directly, noting accumulation is coming from older cohorts rather than short‑term churn.
Important nuance: measuring LTH behavior is heuristic‑driven. The 155‑day threshold is convenient but imperfect. Still, when a wide set of LTH metrics (cohort sizes, age distribution, and coin days destroyed) move in concert, the accumulation read becomes more convincing.
Supply‑in‑profit, MVRV and realized metrics
When a greater share of circulating BTC is in profit, holders are less likely to panic‑sell on moderate drawdowns — they have unrealized gains to lose only on deeper retracements. Metrics like Market Value to Realized Value (MVRV) and supply‑in‑profit show whether the market sits on a foundation of unrealized gains or losses.
If exchange outflows, rising LTH balances, and favorable supply‑in‑profit measures all align, the probabilistic case for durable accumulation strengthens: less available sell liquidity, more holders disinclined to sell, and a technical backdrop that can amplify upside.
The counterarguments: why whale accumulation might be overhyped
Not everyone agrees that these on‑chain signs guarantee a durable run. Critics point to interpretation errors, alternative drivers, and data‑quality concerns.
Exchange flows can be misleading
Moving coins off exchanges is necessary for accumulation, but it's not sufficient evidence of end‑user holding. Large transfers to cold wallets or custodians may reflect over‑the‑counter (OTC) liquidity staging, staking or custodian custody, or even intra‑entity shuffles. Cryptopolitan argues that apparent whale accumulation is sometimes a mirage created by how flows are labeled and aggregated (Cryptopolitan critique).
Examples of misreads:
- Moving coins from Exchange A to Custodian B reduces exchange balance but does not remove supply from potential liquidation if the custodian offers lending or quick re‑deposit services.
- Wash transfers between addresses owned by the same entity can show up as large movement without changing market risk.
Concentration vs. conviction
Even when whales are accumulating on‑chain, concentration raises fragility: a small group with a large share of supply can liquidate into a rally if they need to raise cash. Conversely, broad LTH accumulation dilutes that fragility. Critics caution that headlines citing “whale buys” often conflate large single transactions with a sustained, distributed accumulation trend.
Methodological blind spots in on‑chain heuristics
On‑chain metrics rely on assumptions (age thresholds, address clustering, exchange labels). Analysts can reach different conclusions from the same raw data depending on those choices. Coinpaper and others urge caution: the same charts that hint at a 2026 setup can be read differently when you change cohort thresholds or incorporate off‑chain settlement data (Coinpaper analysis).
Technicals + on‑chain: two plausible 2026 scenarios
Technical compression and on‑chain context together create a framework for scenario planning. CryptoNews lays out a compressing triangle that could resolve to a powerful breakout or a liquidity reset depending on catalyst and order flow (CryptoNews technical read).
Scenario A — Breakout toward new highs (bull case):
- Trigger: renewed demand from spot ETFs, institutional flows, or macro shocks that favor BTC as a store of value.
- On‑chain confirmation: continued exchange outflows, LTHs holding steady or increasing, rising supply‑in‑profit and decreasing realized volatility as a prelude to directional move.
- Market behavior: squeezes on leveraged short positions, fast repricing as depth thins.
Scenario B — Liquidity‑driven reset (bear or consolidation case):
- Trigger: macro liquidity shock, regulatory pressure, or a large holder selling to rebalance.
- On‑chain warning signs: sudden spikes in exchange inflows, resumed spending from previously dormant LTH cohorts, and concentration signals showing large addresses shifting from custody to exchange‑accessible wallets.
- Market behavior: rapid price drawdown, volatility spike, washouts of retail leverage.
Neither scenario is certain. On‑chain metrics change the odds; they don't create inevitability.
Practical implications for traders and institutions
Translate on‑chain reads into rules and safeguards rather than binary beliefs.
Position sizing and risk management
- Use scenario‑based sizing: allocate a base position to the durable‑accumulation view and a smaller tactical tranche to exploit breakout momentum. If LTH metrics continue to show accumulation, gradually scale the tactical tranche up.
- Stop placement: avoid mechanical stops at obvious technical levels that a whale could target. Prefer volatility‑normalized stops (ATR‑based) and laddered stop structures.
Execution and liquidity management
- For larger institutions, prefer OTC and block trades to reduce footprint; track exchange order‑book depth and recent exchange flow trends before executing. Retail traders should monitor exchange flows and not chase large single trades.
- Use dollar‑cost averaging (DCA) during accumulation phases and switch to execution‑sized buys on confirmed breakouts.
Monitoring checklist (real‑time signals to watch)
- Net exchange flows (24h/7d/30d): persistent net outflows are supportive. Sudden inflows are a warning.
- LTH net position change and coin age metrics: rising coin age and expanding LTH balances favor durability.
- Supply‑in‑profit and MVRV bands: help gauge convexity of potential drawdowns.
- Large address behavior and clustering labels: check whether large transfers go to custody, OTC counterparties, or exchange hot wallets.
A word on infrastructure: platforms and analytics that combine order‑book, OTC, and on‑chain data shorten the feedback loop for traders — many agile desks and services (including Bitlet.app users) rely on integrated feeds to align execution with on‑chain signals.
How to separate signal from noise — an actionable checklist
- Corroborate exchange outflows with custody labels. If outflows land at known custodians that provide lending or quick re‑access, downgrade the signal.
- Look for multi‑metric concurrence: exchange flows + LTH cohort growth + rising coin age is stronger than any single metric.
- Watch for behavior changes in previously dormant cohorts — renewed spending by old cohorts is a stronger red flag than small increases in hot‑wallet inflows.
- Combine on‑chain with technical confirmation: a breakout with on‑chain backing is higher probability than one without it.
- Avoid narrative chasing: large single transactions often make headlines but rarely by themselves change probabilities materially.
Conclusion
The evidence suggests there is a legitimate accumulation case for Bitcoin going into 2026: exchange outflows, supportive LTH metrics, and favorable supply‑in‑profit readings are consistent with durable demand. Still, important caveats remain — exchange flows are easily misread, whales can create concentration risks, and heuristics have blind spots. Treat on‑chain signals as probability enhancers, not certainties, and convert them into scenario‑based position sizing, execution rules, and monitoring frameworks.
For intermediate traders and analysts, the immediate task is practical: track a short, high‑quality set of metrics, watch how they converge, and map them to concrete trade plans for both the breakout and reset possibilities. Keeping that discipline will help you avoid falling for the next headline and instead base decisions on evidence and controlled risk.