How Traders Survive Mass Liquidations: A Tactical Playbook from the Feb 2 Volatility Shock
Summary
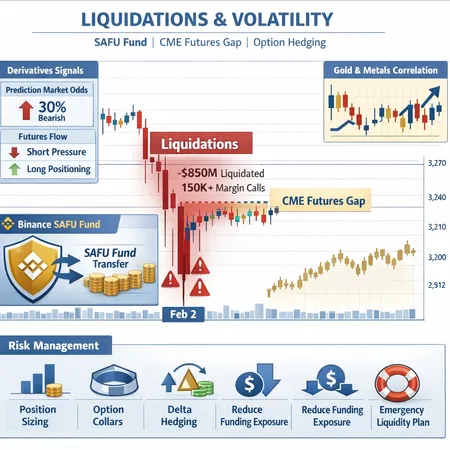
Executive snapshot: what happened on Feb 2 and why you should care
On Feb 2 the crypto market briefly turned into a pressure cooker. Prices plunged, margin calls cascaded, and a reported roughly $704 million in long and short positions were liquidated as BTC dipped toward the mid-$70k range, according to liquidation tallies that capture the scale of the forced-selling wave. That episode didn’t happen in a vacuum: equities and crypto-linked stocks slid in pre-market moves while Bitcoin later stabilized near ~$77k, creating a volatile two-way market for liquidity providers and traders alike.
This guide uses the Feb 2 event as a case study to extract durable, tactical rules. If you trade BTC, CME futures, or run directional books that use leverage, you should walk away with concrete actions to reduce tail risk and preserve optionality when volatility spikes.
Anatomy of the Feb 2 crash: cascade mechanics and empirical tallies
Liquidation cascade and margin pressure
A liquidation cascade is simple in concept but messy in execution: price moves against levered positions, exchanges auto-close margin accounts, forced selling pushes price further against remaining levered holders, and the cycle repeats. On Feb 2, public tallies captured the scale: roughly $704,000,000 in crypto and Bitcoin liquidations were recorded as spot execution and contract unwindings fed on themselves. See the liquidation breakdown for context from live tallies.
Two technical features amplify cascades:
- Funding rate feedback — high funding on perpetuals encourages crowded directional bets that become brittle as funding flips and liquidity providers withdraw.
- Concentration of leverage — clustered exposure at similar price bands (e.g., many longs around a key round number) makes a single break much more damaging.
Cross-asset context: equities, safe-haven flows, and metals
The event coincided with a broader risk-off phase: crypto-linked stocks and market-sensitive equities slid in pre-market trading, underscoring that cryptomarkets are not insulated from macro and equity liquidity squeezes. When traditional risk-assets move, correlated flows can exacerbate crypto volatility because the same players may be deleveraging across books.
Precious metals sometimes behave as parallel risk-off instruments; traders should watch gold and real yields as potential amplifiers or cushions for crypto flows. The key point: cross-asset liquidity conditions matter — a stressed equity tape can remove marginal buyers from BTC just as funding-driven sellers accelerate.
Exchange- and corporate-level actions: how SAFU and balance-sheet buys change short-term liquidity
On Feb 2 Binance moved a sizeable quantity — reported as 1,315 BTC — into its SAFU fund as the exchange signaled plans to convert and buy up to $1 billion in BTC to shore up market confidence. Actions like this have two effects:
- Confidence/psychology: Moves into an exchange defense fund can calm retail sentiment and reduce panic-selling, at least temporarily.
- Real liquidity shift: If exchanges buy or re-allocate reserves (converting fiat or insurance funds into BTC), that reduces available spot liquidity and can deepen short squeezes or reduce immediate sell-side depth.
In short: exchange SAFU moves and corporate buys are liquidity-shifting events. They can stabilize price by signaling backstops, but they can also reduce the pool of natural market makers at key levels if those assets are removed from free float. Traders should account for both the psychological and structural effects when sizing intraday or overnight positions.
Derivatives signals that matter: CME gaps, open interest, and prediction markets
CME futures gaps and their informational value
CME-listed Bitcoin futures can and do open with price gaps after weekend or holiday moves. Feb 2 produced one of the largest CME futures gaps in recent memory, a marker of fragility in the futures basis after a weak January close. These gaps matter because institutional order flow that clears on CME may not transact until exchanges open, leaving a vacuum that amplifies spot moves.
Why traders watch gaps:
- Gaps flag where institutional liquidity was absent. A large futures gap often precedes outsized intraday volatility.
- When CME basis steepens or flips, it can signal fast-moving funding/futures arbitrage flows that suck liquidity out of spot.
(Analysis of the recent CME gap and its historical significance can be found in dedicated futures coverage.)
Open interest, funding rates, and prediction markets
Three derivative indicators give early warnings:
- Open interest spikes — a rapid rise in OI concentrated in one direction (e.g., longs) makes the market brittle.
- Funding rate surges — extreme positive or negative funding rates show crowded bets; abrupt funding reversals accelerate deleveraging.
- Prediction-market pricing — sometimes faster to reflect event risk (regulatory, macro) than spot markets; a sharp change in probablity markets can act as a red flag for liquidity stress.
Combine these inputs rather than trusting any single indicator. A large CME gap plus rising perp funding and clustered OI is a higher-confidence signal that liquidation risk is elevated.
Tactical readout: how exchange moves and derivatives interplay during a crash
Put the pieces together: an equity sell-off reduces margin capacity across desks; funding rate flips force perp shorts/longs to rebalance; a large CME gap signals institutional flow absence; and exchange SAFU moves both calm sentiment and reduce available float. That combination creates a volatile environment where directional positions without robust hedges are likely to be clipped.
For active traders and PMs, the correct mental model is networked fragility — liquidity is endogenous and can evaporate faster than prices move. The best defense is pre-committed rules and automation.
Five concrete risk-management playbooks (actionable rules)
Below are five playbooks designed to be executable, measurably testable, and adaptable across spot, perp, and futures books. Each playbook contains the rationale, an implementation checklist, and trade-offs.
1) Position sizing and leverage caps: make tail risk small
Rationale: The majority of liquidation pain is self-inflicted through oversized positions and leverage.
Implementation checklist:
- Cap gross exposure to a % of NAV (example: 3–7% per directional thesis in volatile assets like BTC).
- Implement max leverage limits by product (e.g., 3x on spot margin, 2x on high-vol perp, lower on low-liquidity alts).
- Enforce tranche sizing for entries (enter in 2–4 tranches tied to volatility bands, not static sizes).
Trade-offs: Lower position sizes reduce upside but protect against ruin — the critical trade-off for institutional continuity.
2) Option collars: protect downside, retain upside
Rationale: Collars are cost-effective protection that limit tail losses while keeping participation in rallies.
Implementation checklist:
- For a long BTC exposure, buy a protective put at chosen delta (e.g., 0.15–0.25) and sell covered calls at a higher strike to offset cost.
- Calibrate strike widths to be useful for expected intraday or multi-day horizons. Use implied vol term structure to choose expiries that are cheapest for puts relative to calls.
- Stress-test collars across scenarios (large overnight gaps, funding-driven squeezes) to ensure they perform when liquidity is thin.
Trade-offs: Selling calls caps upside; collars are best where preservation of capital is prioritized over free upside.
3) Active delta hedging and automated rebalancing
Rationale: When markets move fast, static option positions can produce unwanted directional gamma. Delta hedging reduces exposure and extracts time decay when done systematically.
Implementation checklist:
- Determine target gamma risk per derivative position and set hedging frequency (e.g., time- and move-triggered: rebalance when PnL changes >1% of NAV or delta moves by 0.05).
- Use algorithmic liquidity-recovery tactics—slice hedges across venues to avoid market impact.
- Maintain a mid-day liquidity budget to execute delta hedges when order books thin.
Trade-offs: Frequent hedging increases fees/market impact. Balance between hedging speed and liquidity depth.
4) Reduce funding exposure and diversify financing sources
Rationale: Funding-rate flips and concentrated leverage on perpetuals were central to Feb 2’s speed. Being overexposed to a single funding regime is dangerous.
Implementation checklist:
- Limit net exposure to high-funding perpetuals; hedge via short-dated CME futures where basis can be tracked.
- Stagger funding rolls: avoid synchronized roll dates across models/traders that can force mass deleveraging.
- Keep financing diversity: use a mix of spot, institutional futures (CME), and over-the-counter (OTC) lines so that if one venue withdraws credit, other rails remain.
Trade-offs: More conservative funding reduces carry income but dramatically reduces forced unwind risk.
5) Emergency liquidity plan and automated kill-switches
Rationale: Liquidity, not convictions, wins when markets cascade. A pre-funded, testable emergency plan prevents fire-sale dynamics.
Implementation checklist:
- Pre-allocate a minimum cash/collateral buffer (example: 5–10% of NAV) that is ring-fenced for margin calls and margin maintenance across venues.
- Build a liquidity waterfall: prioritized assets to sell or collateral to post, ordered by expected execution speed and slippage.
- Implement automated kill-switches and throttles: if intraday VaR or realized vol exceeds trigger X, reduce all directional exposure by Y% and disable auto-ramp of strategies.
- Practice the plan in dry runs and record execution slippage to refine thresholds.
Trade-offs: Holding dry powder reduces deployable capital but preserves optionality and survival.
Putting the playbooks into a sample rule-set (template for desk adoption)
Here’s a compact, implementable rule-set you can adopt and backtest:
- Max per-direction exposure: 5% NAV.
- Max leverage: 2x on any perp/future, 0.5x on spot lending.
- Collar policy: all >3% NAV longs must carry a put at 30–90 day expiry with delta >=0.15, financed by selling calls up to 1% NAV.
- Funding cap: net perp funding exposure ≤ 10% of gross leverage; hedge residual with short-dated CME futures.
- Liquidity buffer: maintain 7% NAV in cash/stable assets; automated kill-switch reduces directional exposure by 50% if realized 24h vol > X.
These rules are intentionally conservative; tune thresholds to your liquidity profile, counterparty relationships, and regulatory constraints.
After-action habits: what to record and automate post-event
A disciplined after-action review converts reactive moves into repeatable procedures. For each volatility episode, log:
- Realized slippage versus quoted depth at the time of execution.
- Funding-rate churn and its cost to the P&L.
- Fill rates for option hedges and the time it took to execute delta adjustments.
- Any cross-venue failures (API lags, failed transfers) that impeded emergency measures.
Automate insights into dashboards and adapt thresholds quarterly. Institutional-grade playbooks should be living documents.
Tactical watchlist for the next volatility event
Monitor these data streams in real time and map them to your playbooks:
- Perp funding rate and concentration of top longs/shorts on major venues.
- CME futures basis and any weekend/overnight gaps flagged in the pre-market. (CME gaps were a prominent feature of the Feb 2 weakness.)
- Exchange balance-sheet moves and announcements (e.g., SAFU allocations or reserve conversions by major venues like Binance).
- Open interest flows and sudden OI drops — they often precede liquidity vacuums.
- Cross-asset indicators: equity pre-market weakness, spikes in sovereign yields or FX moves, and flows into gold.
For many traders, Bitcoin will remain the primary bellwether; for multi-asset desks, link BTC risk rules to equity and rates hedges.
Final notes: survive first, trade second
Events like Feb 2 are painful but educational. The liquidation tallies and exchange maneuvers teach two complementary lessons: first, liquidity is ephemeral and must be planned for; second, exchange and corporate actions can be stabilizing yet liquidity-consuming. Traders who survive are those who convert experience into doctrines — clear sizing caps, option hedges, funding diversification, delta discipline, and emergency liquidity plans.
Implement these playbooks, run dry drills, and keep a running list of execution frictions so the next event becomes an advantage rather than an existential risk. On operational details, platforms such as Bitlet.app have tools for trade management and collateral flows that desks can integrate into their automation stacks.
Sources
- Daily liquidation totals: $704,000,000 in Bitcoin and crypto liquidated
- CoinDesk: Crypto stocks slide as Bitcoin stabilizes around $77,000
- NewsCrypto: Bitcoin sees second-largest CME futures gap after weak January close
- CoinDesk: Binance moves 1,315 Bitcoin into SAFU fund as it prepares to buy $1B BTC


