Dissecting Bitcoin’s Rally: Spot ETF Inflows, On‑Chain Buying, and the Road to $100K
Summary
Why the recent rally feels different
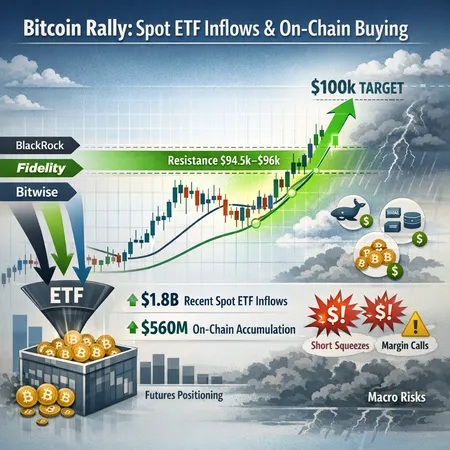
Bitcoin’s latest surge didn’t arrive as a lone price spike — it was the overlap of large, coordinated liquidity entering the market and a technical squeeze that quickly turned a break into a trend. Over the past days, spot BTC ETFs recorded sizable net inflows while on‑chain indicators showed heavy buying from corporations and large deposit activity. Those two forces together both reduce available float and create convexity: when flows are concentrated, price moves accelerate and short sellers get forced out.
For many traders, Bitcoin remains the primary bellwether for crypto risk-on. But this episode is notable because traditional asset managers (BlackRock, Fidelity, Bitwise and others) are not just trading: they are acquiring BTC via spot ETFs as a deliberate accumulation strategy, which changes market microstructure and uptime of demand. The next sections unpack how that works, how big the flows were, and whether they are sustainable.
How spot BTC ETF inflows translate into real Bitcoin demand
ETF mechanics — from dollars to on‑chain BTC
Spot BTC ETFs are intermediaries. When an asset manager receives cash from investors, the ETF can either (a) buy BTC in the open market, (b) use authorized participants (APs) to create shares backed by newly purchased BTC, or (c) source BTC from OTC desks and custodians. In practice, large managers use a mix: APs create or redeem ETF shares with exchanges of cash and BTC, and custodians (and market makers) absorb short-term liquidity frictions.
The immediate market effect is straightforward: ETF inflows mean brokers and APs go into the spot market or OTC desks to buy BTC. Over time, if ETFs are net accumulators, they permanently remove BTC from the liquid pool available to traders, tightening supply.
Who’s buying and how much?
Public reporting and exchange data over the latest sessions show several converging signs:
- Major managers have been consistent net buyers via ETFs — a point covered in a recent compilation of asset managers’ activity showing steady accumulations into spot ETF vehicles. See reporting on asset managers buying via spot ETFs for details. (Cryptonomist)
- On a particularly strong session, BTC spot ETFs logged roughly $753 million in combined inflows, with data highlighting a surge in daily demand that coincided with a price breakout. (CoinSpeaker)
- Exchange and custody flows also flashed red‑hot: one report noted a multi‑billion dollar buying spree, with around $6 billion of BTC activity hitting exchanges over a short window as price ramped. (BeInCrypto)
- Beyond ETFs and retail, corporate and institutional treasuries are still meaningful buyers: public filings and on‑chain treasury moves indicate that some companies were acquiring BTC at a pace several times higher than miners’ issuance during the same period — effectively absorbing newly minted supply. (NewsBTC)
Taken together, these data points make a strong case that multiple buyer cohorts were active at scale simultaneously: ETF flows (institutional wrapper), corporate treasuries (strategic holders), and concentrated exchange deposits (liquidity-hungry participants).
Quantifying the flow backdrop: why supply tightened
The recent flow numbers are best viewed as a stack: daily ETF inflows in the high hundreds of millions, periodic corporate treasury buys that outpaced miner production, and concentrated exchange deposits in the billions. The practical effect is immediate: with ETFs accumulating and corporations refusing to sell, the marginal buyer must chase thinner liquidity, accelerating price moves.
This is not just theory. Reports tracked ETF inflows into the hundreds of millions on key sessions and exchange-level deposit spikes in the billions — both simultaneous — which is a rare problem for marginal liquidity. (CoinSpeaker, BeInCrypto)
Technical breakout: why $94.5–96k was decisive and the path to $100k
The breakout mechanics
Bitcoin cleared a multi‑touch resistance band in the $94,500–96,000 range. That band mattered because it represented the last area of concentrated sellers and option strikes that had been capping rallies for weeks. When ETF inflows and on‑chain buying hit at once, the price breached that band with volume — not a thin liquidity spike.
Technical analysis published during the move flagged the breakout and set $100k as the next logical target, a round number that also coincides with a cluster of longer dated call interest. (CryptoDaily)
The technical path to $100k
From a price‑action perspective the path is straightforward if sustained demand continues:
- Immediate follow‑through requires retesting the breakout zone and holding it as support (now a demand shelf). A clean retest reduces the chance of a failed breakout and attracts momentum players.
- If support holds, stops get cleared from remaining shorts, creating additional fuel via short liquidations (explained below).
- The next measured move is toward the $100k psychological and option‑open interest target, where supply from profit‑taking and larger derivative structures may create resistance.
Traders should watch volume on any pullback: low volume retests are healthy; high‑volume breakdowns would invalidate the technical thesis.
Short liquidations, futures positioning and why squeezes amplify rallies
Short sellers were caught in the move. As price ripped through resistance, exchange-level data and market commentary reported a wave of short liquidations — described as ‘skyrocketing’ on key sessions — which materially fed the rally. (CoinSpeaker)
Futures positioning also matters: when open interest is high and a meaningful portion of leverage is short, any aggressive spot buying forces deleveraging and margin calls that must be covered by buying BTC spot or futures — a classic short squeeze. Evidence from the session showed crowded futures books and rapid deleveraging, which increased intraday volatility and amplified the price move.
Two practical signals to monitor:
- Open interest relative to spot capitalization: sharp rises in open interest ahead of price moves increase the risk of larger squeezes in both directions.
- Funding rates and skew: prolonged positive funding and call-skew in options indicate bullish positioning; violent reversals in those metrics often presage fast corrections.
Is demand structural or momentum-driven? A layered assessment
We can split demand into three buckets and evaluate persistence:
Structural demand (higher persistence)
- Spot ETF accumulation by large asset managers. These flows are sticky because ETFs are long‑term wrappers for client allocations. Institutional reports show managers actively adding via ETFs rather than short-term trading. (Cryptonomist)
- Corporate treasury buys that accumulate on balance sheets; when firms buy BTC as a treasury allocation and hold, those coins are effectively removed from near-term float. (NewsBTC)
Intermediate demand (moderate persistence)
- Buy pressure from exchanges following deposit spikes — these can be a mix of institutional and retail flows that may continue while momentum persists. Past episodes suggest this can last days to weeks but is less sticky than ETF and treasury buying. (BeInCrypto)
Momentum demand (low persistence)
- Short squeezes and momentum-driven retail flows that accelerate moves but can reverse quickly once leverage is cleaned up. Exchange reports from the move noted pronounced short liquidations that fit this bucket. (CoinSpeaker)
Conclusion on persistence: there is a real structural component — spot ETF accumulation and corporate treasury purchases are not trivially reversible. But momentum elements (short squeezes, concentrated exchange buys) amplified the move and can unwind rapidly, increasing volatility even while the structural bid remains.
Macro and liquidity risks that could derail the run
Even with strong receipts of demand, macro variables can flip sentiment quickly. Key risks:
- Central bank policy and rates: hawkish surprises or a repricing of terminal rates can sap risk appetite and force deleveraging across asset classes. Crypto historically amplifies cross-asset shocks.
- Liquidity shock in traditional markets: a sudden spike in credit spreads or a bank stress event could prompt large outflows from ETFs and risk assets.
- Regulatory headlines: adverse policy moves or tax changes impacting ETFs, custodians or institutional flows could slow or reverse inflows.
- Options expiries and dealer flows: clustered options expiries around round numbers (like $100k) can create asymmetric hedging flows that push price away from that strike or cause violent reversals as dealers hedge.
Portfolio managers should not treat ETF-backed demand as an absolute guarantee. Structure reduces tail risk but does not eliminate it.
Actionable considerations for portfolio managers and intermediate investors
If you’re weighing a reweight into BTC, consider a decision framework rather than a binary stance:
- Assess persistence: separate allocation driven by strategic reasons (e.g., a permanent small allocation to BTC as an alternative asset) from tactical overweighting aimed at capturing a momentum leg. Strategic buys can use dollar-cost averaging or periodic rebalancing.
- Use sizing and time horizon: if ETFs and corporate treasuries are adding real demand, a modest increase in core allocation may be justified; larger tactical bets should assume higher intraday volatility and the risk of mean reversion.
- Consider execution: large reweights are best executed across venues and time to avoid slippage. Platforms that support installment or staged buying can help build positions without moving the market — for example, Bitlet.app is one platform that modern teams use to dollar-cost or stage entries.
- Hedge where appropriate: for large allocations, options collars, futures hedges or dynamic rebalancing can manage downside without fully exiting exposure.
- Monitor flow and derivatives signals actively: watch ETF daily flows, exchange deposit patterns, futures open interest, funding rates and major options expiries near round numbers like $100k.
Concrete scenarios
- Bullish base case: Sustained ETF inflows + corporate accumulation continue; breakout holds on retest; $100k is reached as shorts finish covering. Consider modest reweights to long-term allocations, added via DCA.
- Volatility/range case: Flows slow, momentum cooling; price retests the mid $80ks–low $90ks. Maintain core allocation, use tactical allocations opportunistically.
- Bearish fast unwind: Macro shock forces ETF outflows and liquidation of leveraged positions; rapid drawdown. Tighten risk limits and rely on hedges.
Final takeaways
- The current rally has both structural and momentum components: spot BTC ETF inflows and corporate buys provide a sticky bid, while short liquidations and concentrated exchange activity amplified the move.
- Breaking $94.5–96k was technically significant because it removed a persistent supply zone; $100k is now the next obvious target if demand persists. (CryptoDaily)
- Portfolio managers should evaluate reweighting through the lenses of persistence, execution cost and hedging. ETF flows reduce but do not eliminate macro and liquidity risk.
Sources
- Report on major asset managers buying Bitcoin via spot ETFs and aggregate flow data (Cryptonomist)
- Technical analysis: Bitcoin breaks out above key resistance; next target $100k (CryptoDaily)
- Coverage of large ETF inflows and short liquidations (CoinSpeaker)
- On‑chain and treasury accumulation evidence: companies bought 3× miner production (NewsBTC)
- Data on multi‑billion BTC deposits to exchanges during the run (BeInCrypto)


