The Chainlink ETF Era: How Whales Are Shaping LINK’s Price Dynamics
Summary
Introduction: a new era for LINK and what it means for traders
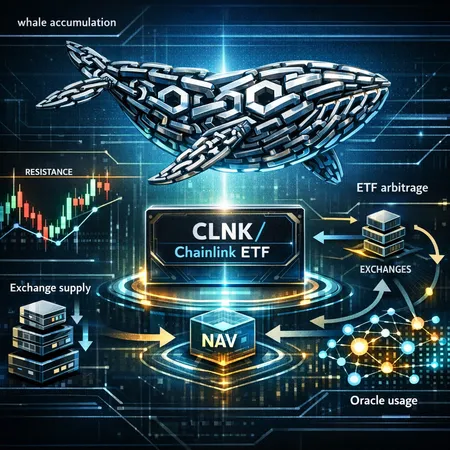
The Bitwise Chainlink ETF — often referenced under the ticker CLNK in conversations — has converted a familiar narrative: LINK as an infrastructure token for decentralized oracles into a tradable, regulated instrument that can sit in institutional portfolios. For many traders, Bitcoin remains the primary market bellwether, but the ETF era places Chainlink squarely in the crosshairs of allocators who prefer exchange-traded wrapper products over spot wallets.
The headline is simple: ETF availability attracts flows. The nuance is where those flows land — on exchanges, in authorized participant (AP) hedges, or inside large whale wallets — and how that distribution interacts with on-chain usage and oracle demand. Reports and on-chain data show heavy whale accumulation since the Bitwise product entered the market, a trend covered by several outlets that tracked both inflows and rising concentration among big holders (DailyCoin, BeInCrypto).
How the Bitwise Chainlink ETF changes the plumbing of LINK markets
ETF structure and ETF arbitrage basics
A sponsored ETF like Bitwise’s behaves as a bridge between institutional capital and spot LINK. Authorized Participants create and redeem ETF shares in exchange for baskets of the underlying asset (or cash equivalents). That mechanism normally keeps the ETF price close to net-asset-value (NAV) through ETF arbitrage: if CLNK trades at a premium, APs can buy spot LINK, deliver it to the issuer, and sell ETF shares; the reverse happens when the ETF trades at a discount.
But the real-world mechanics matter. Creation/redemption is not frictionless — settlement windows, custody constraints, and AP risk limits mean arbitrage isn’t instantaneous, and that delay can be large enough for whales and market makers to exploit or hedge against.
Early flows, AP behavior and whale interest
Coverage immediately following Bitwise’s launch documented inflows into the product while on-chain observations showed large LINK transfers into long-term addresses. BeInCrypto noted rising “whale exposure” post-launch and DailyCoin reported the ETF attracting capital as whales continued to accumulate. These two signals together suggest a coupling between institutional product demand and concentrated accumulation by large holders, rather than broad retail-led distribution.
On-chain whale accumulation: indicators that matter
Supply dynamics: exchange balances and cold-wallet concentration
One of the clearest on-chain signals of accumulation is falling exchange supply. When LINK balances on centralized exchanges decline while top addresses gain, that often indicates long-term cold storage or OTC accumulation — not transient trading. Watch metrics like total LINK on exchanges, percentage held by the top 10–100 addresses, and large transfer counts above defined thresholds (e.g., >100k LINK moves).
Cluster behavior, large transfers and timing
Whales don’t always buy on-spot markets. They use OTC desks, OTC-to-custody flows, and multiple address clusters. Sudden large transfers from exchange clusters to cold-wallet clusters, or coordinated transfers between a set of addresses, are classic accumulation fingerprints. Pairing those on-chain events with times of reported ETF inflows gives high-confidence signals that AP or institutional demand is being warehoused off-exchange.
On-chain oracle usage as a fundamental check
Accumulation is one thing; intrinsic demand is another. Chainlink’s real-world value is driven by oracle calls, active integrations, and fee capture models for node operators and stakers. Track metrics like total oracle request volume, unique smart-contract callers, and growth in data feeds — rising usage strengthens the fundamental story and makes long-term accumulation more credible for investors.
Why CLNK didn’t instantly push LINK above obvious ceilings
Liquidity, market-making and hedging frictions
ETF issuance alone doesn’t guarantee immediate spot price spikes. APs and market makers often hedge ETF exposure via shorting, lending, or delta-hedging strategies that dampen upward moves. If APs can obtain LINK cheaply or borrow it to hedge, they may create temporary selling pressure on spot markets even as ETF flows increase.
Creation/redemption lag and settlement windows
Creation and redemption processes have settlement latencies. During that window, ETF shares can trade at small premiums or discounts while the underlying creation/redemption leg clears. That latency reduces the speed of arbitrage, and in thin order-book situations it can take time for spot prices to reflect ETF demand.
Concentration risk and order-book depth
Most whales accumulate large sums off-exchange. While this reduces circulating supply, price thresholds often require visible liquidity on the order book. If whale accumulation sits in cold wallets rather than on exchange order books, there's less immediate liquidity to absorb buying pressure, and price can stall under resistance even as supply tightens.
Narrative and macro tailwinds
Finally, price action is also a product of narrative. ETFs attract capital only if broader risk appetite and macro conditions permit risk-on allocations. If macro uncertainty or deleveraging occurs, institutional buyers may pause incremental purchases despite product availability.
What on-chain analysts and investors should monitor before following whales
Below are specific, actionable on-chain and market metrics for altcoin investors deciding whether to track whale interest into LINK.
1) ETF flows and market structure
- Monitor daily and weekly CLNK flows and net inflows/outflows; watch for sustained inflows rather than one-offs.
- Track AP activity when visible (large creation/redemption events). Rapid persistent creations that coincide with growing ETF AUM suggest structural demand.
- Watch ETF premiums/discounts to NAV and secondary-market liquidity — widening spreads can signal arbitrage stress.
2) Exchange supply and order-book health
- Exchange balance: a falling exchange supply while top-wallet balances rise is a bullish accumulation signal.
- Depth at key price levels: quantify how much buy liquidity sits below current price. Thin depth + concentrated supply = volatile reactions to large trades.
- Lending and borrow rates for LINK: high borrow rates imply shorting demand; low or negative funding rates can reveal ongoing hedging pressure.
3) On-chain oracle usage (fundamentals)
- Track oracle request growth, number of distinct upstream integrations, and fee accruals for nodes if available. Increasing on-chain usage legitimizes higher valuations and reduces reliance on purely ETF-driven narrative.
- Monitor staking activity (if relevant to LINK economics) and node operator behavior: rising staking/participation can tighten liquid supply.
4) Whale behavior and timing signals
- Look for coordinated transfers from exchange clusters to cold custody and repeated accumulation patterns across addresses.
- Correlate whale buys with on-chain or off-chain signals: Are whales buying into dip moments? Are they accumulating during low-liquidity hours?
- Beware of apparent accumulation that is actually redistribution within a single entity (address churn). Use clustering heuristics where possible.
5) Market derivatives: open interest, implied vol, and funding rates
- Rising perpetual open interest and skewed implied volatility are early signs that traders are positioning for directional moves. Monitoring funding rates can reveal whether pro-trend leverage favors longs or shorts, which impacts how strong a whale-driven rally could be.
Practical frameworks for decision-making
Scenario-based checklist
- Bull case: sustained CLNK inflows + falling exchange supply + rising oracle usage. Action: consider staged entry with size scaled to conviction.
- Neutral case: CLNK inflows offset by rising AP hedging/borrow rates and stagnant oracle metrics. Action: watch for clear break of order-book resistance or confirmation from on-chain usage.
- Bear case: ETF flows absent or reversing + exchange supply rising + increased lending/short interest. Action: avoid chasing; consider wait-and-see.
Risk-management rules
- Don’t follow whales blindly: large holders have longer time horizons and OTC advantages you don’t. Use position sizing, time-based scaling, and stop discipline.
- Use multiple confirmations: combine ETF flow data with exchange-supply declines and improving oracle usage before increasing exposure.
- Be explicit about horizon: whales accumulate for multi-month to multi-year plans. If you are trading on shorter timeframes, manage liquidity and leverage carefully.
Where data sources can complement on-chain reads
Runbook items for analysts: subscribe to reliable ETF flow trackers, use exchange balance dashboards, and combine those with Chainlink-specific telemetry for oracle calls. News and coverage that pointed out immediate post-launch behavior are helpful context — for example coverage that highlighted Bitwise ETF inflows and whale stockpiling provides a narrative anchor while the on-chain metrics provide the actionable signals (DailyCoin report on Bitwise inflows; BeInCrypto coverage of whale LINK inflows).
If you use services like Bitlet.app to dollar-cost over time or for installment buys, make sure your cadence aligns with the signals above rather than headline chase.
Conclusion: follow the data, not just the wallets
The Chainlink ETF era created a new pipeline of demand for LINK, and whales often sit at the leading edge of that flow. But immediate price jumps require visible on-chain liquidity, efficient arbitrage, and positive fundamental usage — not just headlines. For on-chain analysts and altcoin investors, the edge comes from combining ETF flow tracking, exchange-supply dynamics, oracle-usage metrics, and derivatives positioning to form a multi-dimensional view before committing capital.