XRP’s On‑Chain Surge vs. Price Crash: Explaining the Disconnect and What Traders Should Watch
Summary
Snapshot: the paradox in plain terms
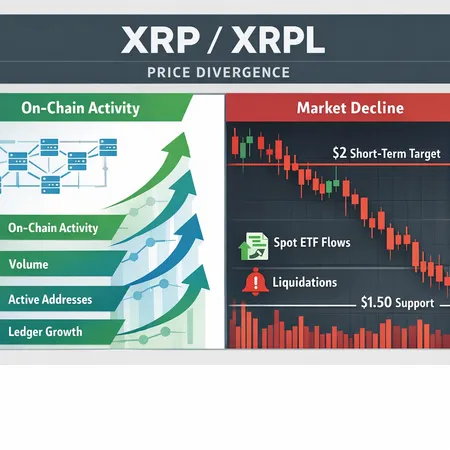
The XRP Ledger is busy. Recent reports show unprecedented transaction counts and ledger growth on XRPL even as XRP’s market price slumped to 9–14 month lows. This split — robust on‑chain activity paired with significant price weakness — raises the question: is this real demand masked by broader market forces, or merely a temporary anomaly?
U.Today documented the ledger’s record activity, noting growth across transactions and account interactions despite price headwinds (U.Today report). At the same time, market coverage highlights XRP’s plunge and the disconnect between on‑chain health and the token’s traded price (CryptoPotato analysis). Understanding the transmission channels that connect macro liquidity flows to XRP price is essential for intermediate traders looking for an edge.
How spot ETF flows, macro BTC moves and liquidations transmit to XRP
The macro picture matters. Spot ETF flows into Bitcoin and large cap products have become a primary sink for crypto liquidity. When significant capital rotates into spot BTC ETFs or out of broader altcoin pools, flows tighten for smaller markets like XRP. FXEmpire’s note about ETF outflows weighing on XRP price and technical tests near $1.50 is a concrete example of this pressure (FXEmpire report).
Correlation to Bitcoin still matters: big directional BTC moves trigger forced deleveraging across derivatives. Long BTC squeezes or weighty ETF inflows can suck liquidity away from altcoins; the reverse happens on BTC drawdowns. Liquidation cascades are particularly pernicious: concentrated leverage in illiquid alt markets leads to stop‑runs that accelerate price declines, even while users continue to transact on the ledger for non‑speculative reasons (payments, remittances, token movements).
Putting it simply: on‑chain activity can be structural and utility‑driven, while market price is a function of marginal liquidity and short‑term risk appetite. When ETF flows reallocate capital, marginal buyers vanish and price can fall even as utilization rises.
Technical picture: $1.50 support and the case for a short‑term rebound to $2
From a price structure perspective, the key horizontal support traders are watching is around $1.50. FXEmpire flagged recent tests of this level, noting that ETF outflows and broader deleveraging tested that floor. If $1.50 holds as a liquidity magnet and macro volatility cools, a short‑term mean‑reversion move toward $2.00 is plausible for several reasons:
- Liquidity exhaustion: capitulation near long‑standing support often triggers short covering and bargain hunting. Large buyers frequently accumulate into clustered stop zones.
- On‑chain demand: rising transaction counts and account activity can indicate genuine end‑user and institutional flows that will re‑absorb selling pressure.
- Technical confluence: $2 sits near prior consolidation zones and is a psychologically salient level for returns of momentum traders.
An AI‑driven short‑term forecast recently suggested a rebound toward $2 by month‑end under a favorable flow scenario, which aligns with the mechanical mean‑reversion case (see the Finbold projection for the specific prediction) (Finbold prediction). That’s not a guarantee — rather, it’s a probabilistic scenario contingent on liquidity rotating back into altcoins and no fresh macro shocks.
Which XRPL on‑chain metrics matter — and why
Not all on‑chain activity carries the same weight. Traders should differentiate between noise (e.g., recycled microtransactions or gas‑driven churn) and meaningful adoption signals. Focus on these XRPL‑specific and general metrics:
- Transaction volume (value): Look at not just count but the value transferred. Large cumulative value moving on XRPL suggests real economic activity. U.Today’s record notes are transaction‑count heavy, so cross‑check sizes.
- Active accounts / daily new accounts: A sustained uptick in new account creation indicates fresh user interest; repeat active accounts imply stickiness.
- Ledger growth / account reserve changes: XRPL ledger growth tied to new trust lines, token issuances, and account reserves hints at ecosystem expansion.
- Large transfers and whale flows: Monitor top‑wallet movements; accumulation into exchanges vs. withdrawals to cold storage shows intent.
- DEX / order‑book liquidity and spreads: XRPL offers an on‑ledger DEX and decentralized offers; widening spreads and thinning order books make price moves more extreme.
- Fee and transaction success rates: Abnormal fee spikes or failed transactions can reveal congestion or stress events that presage volatility.
When examining these, compare on‑chain volumes to CEX order‑book depth. High on‑chain transfers funneling to exchanges typically presage selling pressure; off‑exchange accumulation is a bullish read.
Practical watchlist: resolving the price/on‑chain disconnect
Here’s an actionable checklist for intermediate traders and investors deciding whether the ledger strength will presage a price recovery:
- Confirm conviction with value, not just counts — track 7‑day moving average of transaction value and median transfer size.
- Watch new account growth and spot large new trust‑line creations; these are higher‑conviction adoption signals.
- Monitor exchange inflows vs. outflows for major XRP custodians. Net outflows suggest accumulation, inflows hint at selling pressure.
- Keep tabs on spot ETF flow reports and large BTC flux days. A major BTC inflow day into an ETF often coincides with alt liquidity drawdown.
- Watch derivatives — funding rates and open interest. A spike in short interest on perpetuals or concentrated long deleveraging can create asymmetric risk.
- Track order‑book depth at $1.50–$2.00 across top exchanges. Thin depth through these zones raises the bar for a clean rebound.
- Be sensitive to macro events and scheduled catalysts: CPI prints, Fed commentary, or major ETF rebalancings can flip sentiment quickly.
Use on‑chain dashboards that allow cross‑filtering (e.g., large transfers vs. exchange addresses) to reduce false positives. If you use platforms like Bitlet.app for managing positions or recurring buys, ensure you factor in liquidity and execution risk around these technical bands rather than dollar‑cost averaging blindly into high‑volatility zones.
Scenario framing: what a believable recovery looks like
A convincing recovery narrative would combine several elements: sustained net outflows from exchanges (indicating accumulation), rising transaction value on XRPL with larger median transfer sizes, consolidation of order‑book liquidity around $1.50, and cooling macro volatility or reversal of ETF‑led alt drains. In that scenario, short covering and fresh bids could push price toward $2 quickly.
Conversely, if on‑chain growth is dominated by low‑value churn, exchange inflows spike, and BTC experiences another liquidity‑sucking rally, on‑chain strength will likely remain a background statistic while price retests lower zones.
Final tactical notes for traders
- Treat the price/on‑chain divergence as a timing puzzle, not a contradiction: utility can grow while marginal liquidity retreats.
- Use layered entries: consider smaller initial exposure with plan to scale if on‑chain value and exchange outflows confirm.
- Size risk around derivatives carefully; liquidation cascades are a primary transmission mechanism.
- Keep alerts on: large whale transfers, sudden exchange inflows, and funding‑rate spikes.
On‑chain metrics give you a window into structural demand, but market price is ultimately decided at the margin. Watch both.
Sources
- U.Today — Records of unprecedented activity on the XRP Ledger: https://u.today/xrp-ledger-breaks-historical-record-as-xrp-price-paints-number-of-the-beast?utm_source=snapi
- CryptoPotato — Coverage of XRP plunging to multi‑month lows and the market disconnect: https://cryptopotato.com/ripples-xrp-plunged-to-14-month-low-whats-good-whats-bad-and-whats-next/
- FXEmpire — Technical analysis noting $1.50 support tested and ETF outflows weighing on price: https://www.fxempire.com/forecasts/article/xrp-news-today-1-5-support-tested-as-etf-outflows-weigh-on-price-1576440
- Finbold — AI‑driven short‑term price forecast suggesting a rebound to $2 by month‑end: https://finbold.com/ai-predicts-xrp-price-for-february-28-2026/?utm_source=snapi


