Ethereum’s Active Addresses Are Surging — Bull Signal or Bubble Noise?
Summary
The paradox: more addresses, less price
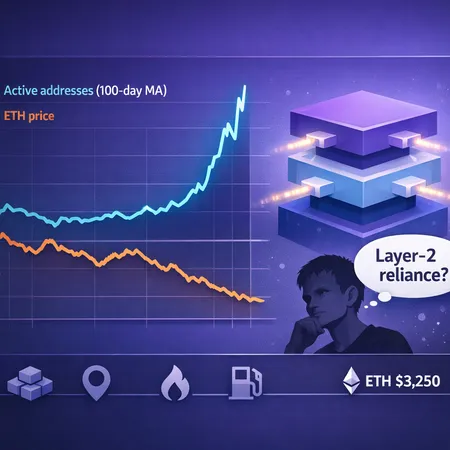
Ethereum's network is busy. Several on-chain trackers registered a notable uptick in active addresses — and a striking rise in the 100-day moving average — even as ETH slipped from recent highs. That divergence is not merely a curiosity; it forces a question every developer and holder should ask: does growing on-chain activity equal a stronger price foundation, or is it a mirage created by new forms of on-chain usage?
Reports highlighting the jump in active addresses help frame this paradox: an on-chain data snapshot shows activity nearing all-time levels even as price does not follow source reporting the spike. A 100-day MA spike indicates persistence — it's not a one-day bot burst — but persistence in what kind of activity matters.
Reading the 100-day moving average: sustained growth or structural noise?
The 100-day moving average (MA) smooths out blips and signals trend continuity. When active addresses' 100-day MA rises, it implies more users have been consistently transacting or interacting over months. That's meaningful: it suggests repeated usage rather than a single headline-driven surge.
But not all active addresses are equal. A wallet sending dust across thousands of addresses, automated L2 batch settlements, or bridge churn can inflate the metric while offering limited incremental economic demand for ETH.
- Quality signals: new smart-contract interactions, growing fee revenue, rising L2 TVL that reflects genuine product usage (DEX trades, lending, NFT minting), and increased developer deploys.
- Noise signals: repetitive micro-transactions, MEV bots, high-frequency bridge shuffling, or airdrop farms creating addresses to chase token distributions.
The bitcoinist data shows the headline jump in active addresses, but to classify that as bullish you need corroboration from complementary metrics: fees, unique contract calls, L2 throughput and TVL, and on-chain flows to/from exchanges.
Activity vs. price: why correlation breaks down
Historically, on-chain activity and price often move together over longer windows — broader adoption tends to lift valuation. Yet short-to-medium term dislocations are common. There are several reasons the correlation breaks:
- Differing drivers: On-chain activity can rise from developer or product adoption while macro liquidity for speculative inflows is scarce. 2. L2 complexity: much user activity now happens on rollups (or interacting with rollups through the base chain), so the base-layer price reaction lags. 3. Speculative churn: active addresses can be dominated by bots or users chasing transient yields.
Recent analytics coverage points to rising on-chain metrics but simultaneously warns of near-term price vulnerability — on-chain surges do not guarantee immediate price strength and may precede volatile corrections analysis linking on-chain surges to risk. Technical and on-chain pattern reads have even suggested downside ranges that traders should not ignore technical analysis pointing to potential downside.
Vitalik Buterin and the layer-2 scaling question
Layer-2 rollups have been Ethereum's practical scaling story: they deliver throughput and lower costs, and they explain much of the user-activity growth. But Vitalik Buterin has publicly questioned whether leaning on L2s as the primary scaling model remains sensible in the long term, raising concerns about composability, fragmentation, and security trade-offs Vitalik's critique.
His point forces a re-evaluation. If L2s become the dominant locus of transactions, you get higher nominal activity but also:
- Composability frictions: UX and inter-rollup communication can be awkward, reducing the seamless composability that made Ethereum's base-layer DeFi powerful. This impacts developer choice and long-term product design.
- Concentration risk: a small number of sequencer/operator designs could centralize failure modes.
- Price signaling ambiguity: if most economic activity happens off-chain (or off-mainnet in rollups), the base-layer token's price may reflect different fundamentals — staking economics, MEV capture, and the perceived security premium — rather than raw transaction counts.
In short: L2-driven activity is real usage, but Vitalik's critique reminds us to judge whether that activity increases the economic value accruing to ETH or simply enables cheaper transfers without materially expanding the asset's demand base.
What this means for developers and mid-to-long-term ETH holders
Developers: interpret rising active address counts as a market for product experimentation. A large and persistent user base validates that people are trying things on networked apps; it just doesn't validate every product.
- Prioritize metrics that show sticky product use: DAUs for apps, repeat transaction rates, composability interactions across protocols, and revenue capture (fees, protocol revenue).
- Track L2-specific metrics in addition to base-layer statistics: sequencer uptime, withdrawal latency, rollup gas usage, and cross-rollup messaging reliability.
Holders (mid-to-long-term): treat the surge in active addresses as an ambiguous but potentially constructive signal. Your decision framework should emphasize the quality of adoption and macro positioning.
- Bullish signals: persistent growth in unique smart-contract interactions, meaningful fee accrual to stakers/node operators, rising developer deployments, and organic application-level growth across rollups and the mainnet.
- Cautionary signs: growth driven by bridges, airdrops, bot farms, or transient memetics; sharp divergence between spot flows and on-chain use; and macro liquidity tightening.
Platforms in the ecosystem — including services like Bitlet.app — reflect that long-term holders are increasingly using installment and earn products to manage exposure. That doesn't replace due diligence but underscores the market's growing maturity.
Trading implications and risk management
For shorter-horizon traders, this environment favors strategy clarity and strict risk controls.
- If you trade momentum: wait for confirmation across price, exchange inflows/outflows, and fee revenue; avoid relying solely on active-address headlines.
- If you trade range or mean reversion: the price vulnerability noted by analysts suggests setting tighter stop losses and watching on-chain liquidity metrics.
For position holders planning multi-year exposure:
- Dollar-cost averaging (DCA) into conviction can blunt timing risk if you believe in long-term network effects.
- Rebalance based on objective signals: quarterly reviews of developer activity, TVL across rollups, staking participation, and changes in fee capture.
- Maintain exposure size consistent with your risk tolerance; treat on-chain surges as one input among many.
Practical checklist: how to separate signal from noise
Use this checklist to interpret active-address growth:
- Is the growth concentrated in a handful of addresses or widely distributed?
- Are smart-contract interactions increasing, or primarily simple transfers/bridges?
- Are L2 TVL and throughput increasing in tandem with base-layer activity?
- Are fees and protocol revenues trending up (suggesting economic capture)?
- Are exchange flows and derivative open interest signaling accumulation or distribution?
If most answers point toward diverse, contract-level engagement and revenue capture, the on-chain picture tilts bullish over the medium term. If not, treat the surge as higher risk.
Bottom line
The climb in Ethereum active addresses — especially visible in the 100-day MA — is an important data point, but not a binary signal. It can indicate genuine adoption that underpins ETH's long-term narrative, or it can be composed of lower-quality activity that masks price vulnerability. Vitalik Buterin's skepticism about over-relying on layer-2s only sharpens the need to judge the quality of on-chain activity, not just its quantity.
For developers and mid-to-long-term holders: dig deeper than headline metrics. Track revenue capture, composability trends, L2 health, and exchange flows. Use measured exposure strategies and treat on-chain gains as part of a broader evidence set — not an automatic buy trigger.
Sources
- Ethereum active addresses near all-time high — Bitcoinist
- Vitalik Buterin questions whether layer-2s still scale Ethereum — Coinpaper
- Ethereum price classic chart pattern suggests ETH will go below $2k — Cointelegraph
- Ethereum price: high-risk zone as on-chain metrics surge — Crypto.News
For ongoing metric tracking, consider pairing on-chain address analysis with application-level KPIs and L2 telemetry — and keep an eye on broader macro liquidity conditions that ultimately move risk assets like ETH.
For context on ecosystem topics like NFTs and DeFi that can drive on-chain demand, check coverage on Ethereum and applications across DeFi.