Macro Risk
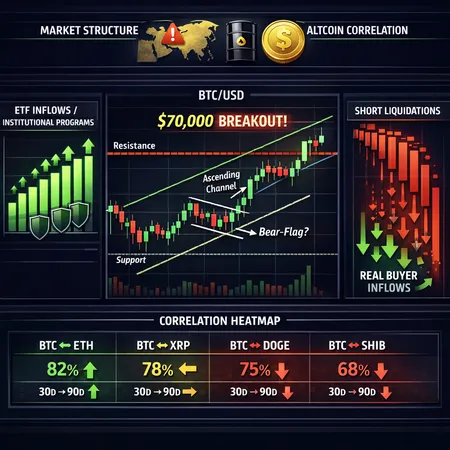
Bitcoin’s move past $70K combined ETF inflows, institutional buy programs and large short liquidations — but is the rally real or just a squeeze? This analysis breaks down drivers, technical risks, macro crosswinds, and practical scenarios for ETH, XRP, DOGE and SHIB over the next 30–90 days.
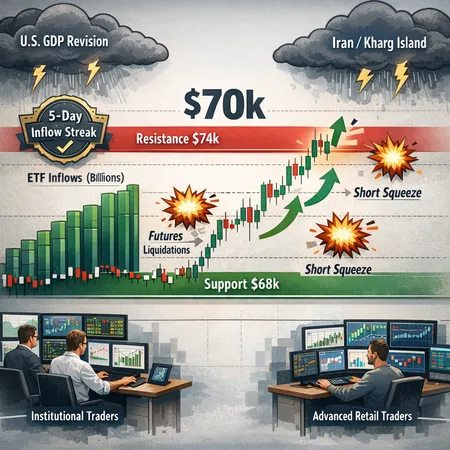
Sustained spot-Bitcoin ETF inflows have propped BTC around $70K, but futures liquidations, short squeezes and macro/geopolitical shocks keep a decisive breakout uncertain. This article breaks down the flows, intraday mechanics, scenario-based technical levels, and practical positioning guidance for institutional and advanced retail traders.
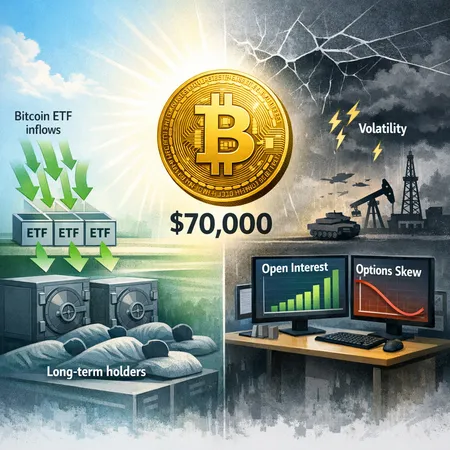
Fresh ETF inflows have pushed BTC toward $70,000, but rising open interest, defensive derivatives positioning and on-chain dormancy by long-term holders paint a mixed picture. This article parses the data to assess whether flows justify a sustainable breakout or a fragile top.
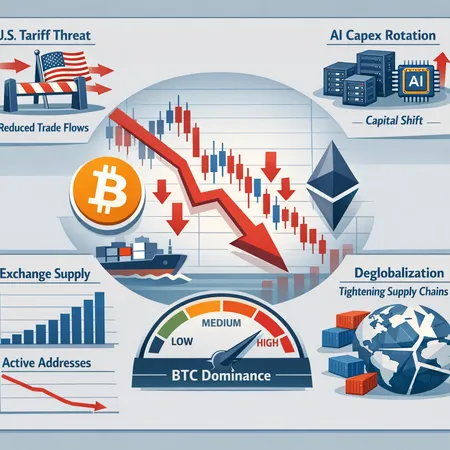
A macro sea change — tariff threats, capital rotation into AI/large-cap tech, and deglobalization — is reducing risk appetite for crypto and helping explain the recent drawdown. This piece unpacks the transmission channels to on‑chain indicators (exchange supply, active addresses, BTC dominance) and lays out portfolio-level adjustments for volatility control.
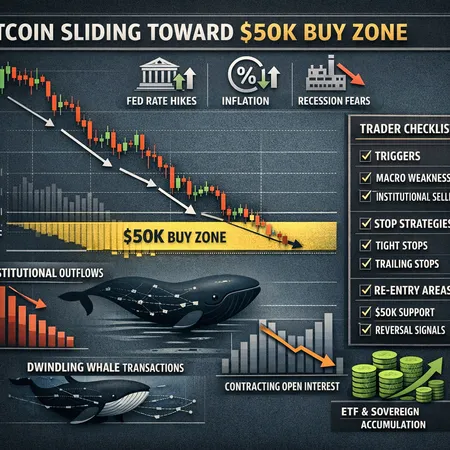
A run-through of macro, on‑chain and derivatives signals that could drive BTC toward the $50K zone, with a balanced checklist for traders on triggers, stops and re‑entry areas.
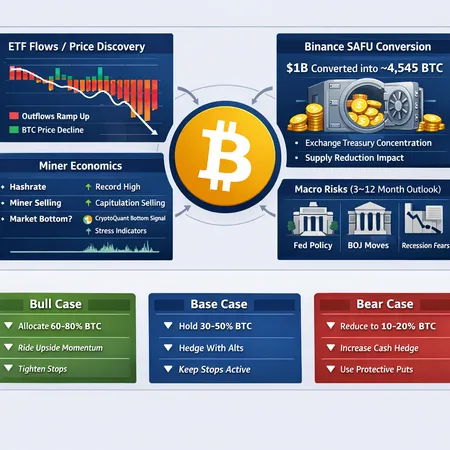
A synthesis of ETF flow data, exchange treasury behavior, miner economics and macro signals to assess whether BTC is close to a cycle bottom and what allocators should do over the next 3–12 months.

On‑chain loss metrics are flashing levels comparable to the 2022 Luna collapse, but macro headwinds and market structure nuances complicate the picture. This analysis reconciles the signals from Net Realized P/L, CryptoQuant commentary, and a strong jobs report to give traders concrete risk management steps.
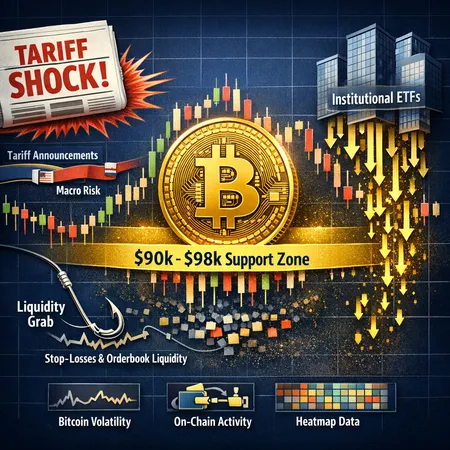
January’s tariff headlines rattled markets, but Bitcoin defended key psychological ranges as liquidity dynamics and steady ETF inflows reshaped short‑term volatility. This article unpacks the timeline, on‑chain and order‑flow evidence for local lows and liquidity grabs, and practical risk management for traders and asset managers.