Is Bitcoin Near a Cycle Bottom? ETF Flows, SAFU Conversion, Miner Stress and Macro Risks
Summary
Executive snapshot
Is BTC within arm’s reach of a cycle bottom? The short answer: maybe, but it depends on which signal you weight most. ETF inflows and outflows, concentrated exchange treasury buys, miner selling pressure and macro liquidity are each pulling price discovery in different directions. For many traders, Bitcoin remains the primary market bellwether — but the plumbing under that bell is changing.
ETF flows: why multi‑week outflows matter for price discovery
Over recent weeks, spot Bitcoin ETFs have recorded multi‑week net outflows, a notable reversal from 2023–2024 when these products were near‑constant marginal buyers. That trend is described in reporting on ETF net flows and broader market flows, which shows institutions and funds moving from being structural demand into a more neutral or even selling posture. When ETFs buy consistently they act like a predictable liquidity sink; when they stop or reverse, that sink becomes a source of volatility.
Why does this matter? ETFs change where and how price is discovered. With positive flows, ETF bids can absorb large sell orders, compressing drawdowns and supporting higher valuation multiples. When flow turns negative, price discovery shifts back to spot markets and OTC desks where liquidity is patchier and bid/ask spreads widen. In practice, multi‑week outflows mean smaller shocks can produce larger intraday moves and discounts to NAV — not an environment that easily births a confident, media‑proclaimed bottom.
(For context on recent ETF flow figures and market flow narratives see reporting on ETF net outflows.)
Exchange treasuries and SAFU conversion: concentration of supply
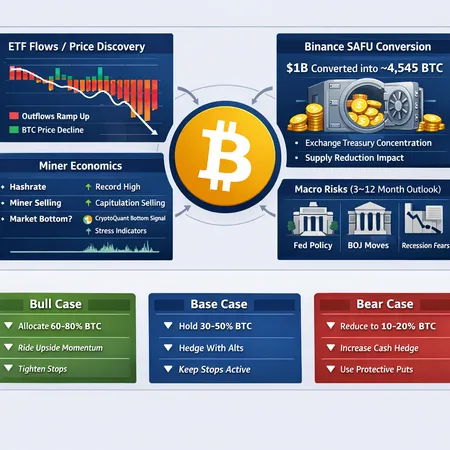
A parallel but often overlooked supply-side development is the growing size of exchange treasuries on balance sheets. Binance, for example, reportedly converted $1 billion of its SAFU reserves into roughly 4,545 BTC. That single move illustrates two opposing forces at work.
First, when exchange treasuries buy BTC, they remove coins from circulation and can tighten available liquidity — a bullish technical effect if coins are effectively taken out of market rotation. Second, the same action concentrates selling power in a small number of custodians. An exchange treasury with a multi‑billion USD balance sheet has far greater capacity to influence market microstructure than a dispersed set of retail holders. If the exchange needs to liquidate (for balance‑sheet reasons, regulatory pressure, or margin stress elsewhere), those BTC can quickly reenter the market as large, well‑timed supply.
Net effect: SAFU conversions and other exchange treasury accumulations can support price in the short term by reducing float, but they also increase systemic tail‑risk because the potential future supply becomes concentrated and correlated.
Miner economics — real stress and what on‑chain signals show
Miners are the other large supply-side actors. Several on‑chain indicators have signaled miner stress in recent months: elevated coinbase outflows, rising realized costs vs hashprice, and miner revenue compression as fees and block rewards calibrate to current prices. Analysts using CryptoQuant‑style models have argued these signals imply miners are under pressure and will continue to sell into rallies, keeping a lid on sustainable upside.
CryptoQuant analysts (as summarized in commentary on a CryptoQuant bottom thesis) have placed a bear‑market bottom at levels materially higher than prior cycles in nominal USD terms, but also warn of extended consolidation if miners maintain selling and if macro liquidity remains tight. That stands in contrast to other analysts who argue market stress is already priced in and that capitulation may be close.
The crucial point: miner selling is not a single discrete event but a flow that can persist for months. If miners are covering costs or servicing debt, they will sell incrementally into rallies — eroding the potency of those rallies and prolonging range‑bound behavior.
Macro risks: rates, central banks and recession talk
Outside crypto, the macro backdrop remains a major determinant of whether BTC can rally decisively. Central bank policy (Fed tightening or easing, the Bank of Japan shifts), real yields and recession risk all feed into crypto risk premia. Some macro analyses point to new data that could point toward an unlikely‑but‑possible 2026 recession, while others see early easing as a potential liquidity wind for risk assets.
If the Federal Reserve signals a slower pivot or real rates stay elevated, correlated risk‑assets like BTC may stay range‑bound or fall. Conversely, an earlier‑than‑expected easing cycle or quantitative easing restart — or a sudden shift in Japan's yield curve dynamics — could release liquidity that flows back to BTC. The macro path is still the wildcard: it can convert what looks like a bottom into a multi‑month base, or it can turn a local low into another leg down.
Reconciling the narratives: is a bottom close?
You can frame the conclusion in two competing narratives:
Construction narrative (near bottom): Some on‑chain exhaustion indicators, lower miner profitability priced in, and pockets of concentrated buy support (including exchange treasuries) suggest selling pressure may be abating. Analysts who track realized losses and long‑term holder behavior argue capitulation has occurred and the market is primed for mean reversion.
Consolidation narrative (lower for longer): ETF outflows reintroduce meaningful selling pressure, miners may continue incremental distribution, and macro risks can keep liquidity constrained. Under this view, BTC is more likely to churn in a wide range for months rather than explode higher.
Both narratives are supported by data. The difference is weighting: give more credence to ETF outflows and active miner selling, and you stay cautious; emphasize treasury accumulation and on‑chain accumulation by long‑term holders, and you get constructive scenarios.
Actionable scenarios (3–12 months)
Bull case (15–25% probability)
- Trigger: sustained return of positive ETF flows, clear easing rhetoric from the Fed, and a visible drop in miner selling. Exchange treasuries hold rather than sell. Liquidity returns to spot markets.
- Price outcome: a quick move above recent resistance levels and attempt to retest the prior cycle highs or major moving‑average confluence within 3–6 months.
- Tactics: add exposure opportunistically using layered buys; consider options strategies (bull call spreads) to leverage conviction with defined downside; reduce cash drag but keep a 10–25% cash buffer for tactical re‑entry.
Base case (45–60% probability)
- Trigger: ETF flows remain neutral to slightly negative, exchange treasuries hold, miners continue to sell into rallies, and macro data stays mixed. Range trading resumes.
- Price outcome: BTC grinds in a broad range with occasional 20–30% swings but no clean breakout within 3–12 months.
- Tactics: dollar‑cost average (DCA) into core positions, rebalance to target allocations rather than chase volatility, use staggered buys (platforms like Bitlet.app can make staggered buys easier), and employ options collars or put hedges for large concentrated positions.
Bear case (20–30% probability)
- Trigger: renewed large ETF outflows, forced selling from exchanges or leveraged counterparties, or macro shock (unexpected tightening or sizable recession signals). Miner capitulation accelerates.
- Price outcome: another leg down and test of structurally important support levels; protracted consolidation that could take 6–12 months to resolve.
- Tactics: trim speculative size, increase cash allocation, lean on hedges (inverse futures or protective puts), and avoid adding meaningful size until clear signs of washout (spike in on‑chain illiquidity metrics or forced selling events).
Position sizing and risk rules for allocators
Define a policy band: set a target allocation to BTC (e.g., 1–5% for conservative, 5–15% for growth‑oriented portfolios) and a rebalancing band (±25% of target). Avoid discretionary large ad‑hoc changes.
Use staged entries: divide intended new allocation into 3–6 tranches spaced across time or price levels. This reduces timing risk in a patchy liquidity environment.
Size by portfolio concentration: limit any single crypto exposure so that a 50% drawdown does not threaten overall portfolio objectives. For many allocators this means keeping BTC exposures within the policy band described above.
Hedging: for large allocations, consider inexpensive time‑limited hedges (put spreads, collars) during periods of elevated macro risk. Avoid long‑dated, expensive hedges unless you have a strong conviction.
Liquidity readiness: maintain cash or high‑quality liquid assets to buy into dislocations. If ETF flows remain negative and miner selling persists, the best buys are often available to those with dry powder.
Monitor the plumbing: watch ETF flow data, exchange treasury filings/announcements, miner outflows, and macro datapoints. These are leading indicators for regime change.
Practical checklist for the next 90–365 days
- Track weekly ETF flows and ETF‑to‑spot NAV spreads.
- Watch exchange treasury disclosures and notable conversions (e.g., SAFU conversion size and timing).
- Monitor miner outflows, hashprice and exchange inflows from known mining addresses.
- Keep tabs on macro signals: Fed commentary, US payrolls, CPI, and major central bank policy shifts.
- Have a pre‑defined rebalancing and hedging playbook rather than reacting to headlines.
Conclusion
Is Bitcoin near a cycle bottom? It depends on which signal you believe will dominate. Multi‑week ETF outflows and miner selling argue for caution and a likely extended consolidation; large exchange treasury buys can provide temporary support but also concentrate systemic risk. The macro backdrop remains the ultimate wild card. For most allocators the prudent path is a rules‑based approach: staged entries, position sizing inside policy bands, modest hedges when exposures are large, and preparedness to add on clear washout signals rather than on hope.
Sources
- Reporting on ETF net outflows and market flows: Cointelegraph on ETF flows and market impact
- Binance SAFU conversion to BTC: Coinpedia on Binance converting $1bn SAFU into Bitcoin
- Macroeconomic view arguing BTC near bottom: CryptoSlate on BTC being near the market bottom and macro signals
- CryptoQuant bottom thesis and miner/indicator warnings: Blockonomi summary of CryptoQuant analysis