Can ETF Inflows Hold Bitcoin at $70K? Data, Short Squeezes, and Macro Risks
Summary
Executive snapshot: inflows versus noise
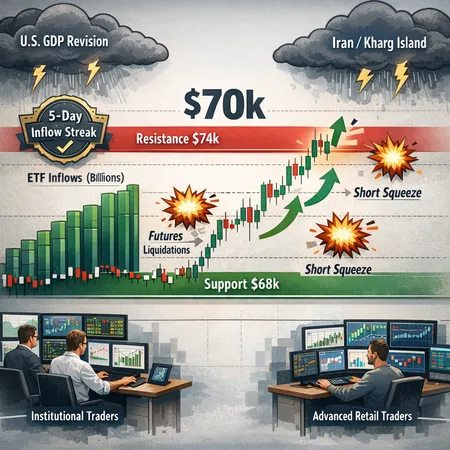
The short answer: yes, ETF demand is real and material, but it’s not a guarantee of an immediate, sustained breakout. US spot-Bitcoin ETFs have recorded consecutive daily inflows — including a notable five-day streak — that demonstrate persistent institutional accumulation and provide a structural bid beneath BTC near $70k (CoinTelegraph report). At the same time, the market is repeatedly shaped by fast, mechanically amplified moves: large futures liquidations and episodic short squeezes can erase intraday gains or create brief rallies that feel decisive but lack staying power (NewsBTC analysis of the short squeeze).
For many traders, Bitcoin remains the primary market bellwether — ETF flows are a baseline demand signal, but macro headlines and derivatives activity still determine whether that demand converts into a clean breakout.
Data-driven look at ETF flows and their market effect
Spot-Bitcoin ETFs are effectively funneling institutional dollars into a concentrated passive demand channel. The recent five-day inflow streak reported by CoinTelegraph shows that money managers and asset allocators are steadily committing capital. That steady demand does several things:
- It lifts the lower bound of typical intraday sell-side liquidity by absorbing spot supply.
- It creates predictable, programmatic buying that can offset retail or tactical selling in ranges.
- It changes marginal price sensitivity: when ETFs buy on dips, dealers and market makers hedge with futures, which in turn affects basis and funding.
Quantifying the exact net-bid is tricky because ETFs trade off-exchange, but short-term correlations between large inflow days and reduced realized volatility are visible in orderbook depth snapshots. Nevertheless, ETF flows are one leg of a multi-legged picture — they provide steady bid, not necessarily explosive fuel for an immediate breakout without conviction from other market participants.
How futures liquidations and short squeezes amplify moves
When ETFs buy spot, counterparties commonly hedge in derivatives (e.g., selling futures). That hedging behavior makes the futures market a pressure valve: if price moves against concentrated positions, forced liquidations cascade.
Recent episodes show this interplay clearly. A pronounced short squeeze wiped out roughly $246M in futures bets and helped lift BTC back into the low $70k range within hours, demonstrating how derivatives can produce outsized intraday momentum even while the underlying structural picture remains unchanged (NewsBTC short-squeeze coverage).
Mechanics to watch:
- Concentrated open interest clusters: large OI around key strikes/levels makes liquidation cascades more likely.
- Funding rate stress: persistently negative or positive funding can accelerate squeezes as traders pile on.
- Dealer hedging flows: ETF buys that are hedged via selling futures compress the available short gamma and increase fragility.
In plain terms: ETFs steady the floor, but the ceiling (and intraday volatility) is set by where leveraged players are sitting — and those players are prone to rapid unwinds.
Macro and geopolitical headwinds: why $70K is under pressure
ETF inflows are a demand anchor, but macro and geopolitical shocks repeatedly inject downside risk. Two recent developments are illustrative:
- A US GDP revision that showed growth slowing and ongoing sticky inflation complicates the Fed outlook and increases the probability that risk assets get repriced if growth disappointment turns into a liquidity shock (CryptoSlate coverage of GDP and inflation).
- Geopolitical escalation tied to threats against Iranian oil infrastructure — which briefly sent BTC below $71k — shows how real-world flash events can prompt risk-off flows regardless of ETF demand (Coinpedia report).
These shocks have two effects: they raise the likelihood of drawdowns that test ETF buying, and they increase macro-driven capital flows into safe-haven assets or cash, which can overwhelm programmatic ETF bids in violent sell-offs.
Technical ranges and scenario planning (practical levels to watch)
Price action in the last several sessions looks like a consolidation band. Use this as a framework rather than a prediction.
Base levels (near-term):
- Support band: $68,000–$69,000 — this is the ETF-backed floor where repeated buys have shown up. A daily close below $68k increases the odds of a deeper test toward $64k–$66k.
- Immediate resistance: $73,500–$74,000 — the market has failed to clear this band decisively in recent attempts, and analysts note a structural bottom is still forming without a breakout above here (NewsBTC analysis of resistance).
Scenario A — Bullish breakout (probability if macro stable): sustained close above $74k on volume and positive futures term structure; target range $78k–$85k as momentum traders and re-shorters are forced to cover. ETF flows would likely accelerate allocations once momentum confirms.
Scenario B — Controlled pullback (most likely in mixed macro): price retests $68k–$66k, ETFs continue dollar-cost averaging, dealers rebalance hedges; this is a range-bound environment that favors tactical options strategies and staged accumulation.
Scenario C — Macro shock sell-off (tail risk): a decisive breakdown under $64k driven by macro/geopolitics or liquidity crunch; ETFs can slow if redemptions or operational frictions arise, and forced deleveraging in futures could exacerbate declines.
Trade and positioning guidance
Below are pragmatic, size-aware strategies for institutional allocators and advanced retail traders who believe ETF demand is a meaningful bid but respect macro and derivatives risks.
Institutional playbook
- Size and workflow: use staged OTC buys for allocations to avoid signaling and market impact. Pair spot accumulation with OTC block trades and staggered settlement windows on Bitlet.app or similar venues to reduce front-running.
- Hedging: establish asymmetric hedges — e.g., collars (long spot, buy OTM puts, sell OTM calls) to cap drawdowns while funding some cost via call premiums.
- Options liquidity: use customized option structures (laddered puts, variance swaps) to tail-hedge against macro shocks rather than relying solely on futures.
- Execution: keep skew and term-structure in mind — if hedgers push up short-dated implied vols, consider longer-dated hedges to avoid costly rollovers.
Advanced retail / discretionary traders
- Position sizing: keep single-trade exposure conservative (e.g., 1–3% of liquid net worth) given tail risk. Use smaller size but higher conviction entries.
- Tactical entries: scale in under $69k if conviction is long-term; use limit orders to avoid chasing squeezes. Consider buying call spreads instead of naked calls to control theta decay.
- Risk management: set stop levels by technical regime — under $68k for scaled partial exits, under $64k for full risk-off (depending on appetite). Avoid holding large perpetual-long positions without hedges when funding is high.
- Use of futures: prefer hedged, delta-neutral constructions if using leveraged instruments. Be mindful that funding and liquidation mechanics can flip quickly during squeezes.
Options-specific tactics
- Buy protective puts for tail risk — ladder strikes so you don’t pay for downside protection at a single strike.
- Sell covered calls against spot holdings to fund puts (creates a collar) if you’re willing to cap upside in exchange for downside protection.
- For tactical leverage, consider debit spreads to limit max loss; avoid naked short gamma in a market prone to squeezes.
Execution discipline
- Avoid getting cute in the immediate aftermath of a large short squeeze — these moves often roll back. Confirm breakout with multi-day closes and increasing volume.
- Monitor derivatives metrics: open interest clusters, funding rates, and liquidation heatmaps. A stable breakout typically shows a healthy term structure, rising futures basis, and sustained ETF consistent inflows.
What would change the thesis?
Watch for these signs that would materially alter the ETF-support narrative:
- ETF outflows or slowing subscription pace: If inflows reverse, the structural bid wanes quickly.
- A liquidity shock in tradFi: sudden deleveraging or a major credit event could push risk assets lower irrespective of ETF mechanics.
- Persistent surge in leverage under the market: unsustainably large long futures positioning that forces convex unwind toward downside.
Conversely, a decisive multi-day close above $74k with robust volume and expanding ETF inflows would increase the probability that the ETF bid is now the dominant price driver.
Final checklist for portfolio managers
- Confirm instrument: use spot for long-term exposure and OTC/spot to avoid basis friction; use options/futures for hedges and tactical plays.
- Scale in: layer long exposure in tranches, reducing execution risk.
- Hedge tails: allocate a small budget to protect against macro shocks.
- Monitor on-chain and derivatives: ETF flows, open interest, funding, and liquidation maps.
ETF demand is a meaningful structural story, and it has kept BTC supported near $70k. But structural demand ≠ guaranteed breakout: futures liquidations, short squeezes and macro/geopolitical shocks can and do decide the near-term direction. For traders and allocators, the efficient path is to respect the ETF bid while preparing for the derivatives-driven noise and macro risk that can produce sharp, transient reversals.
Sources
- https://cointelegraph.com/news/spot-bitcoin-etfs-five-day-inflow-streak-2026?utm_source=rss_feed&utm_medium=rss&utm_campaign=rss_partner_inbound
- https://www.newsbtc.com/news/bitcoin/bitcoin-climbs-back-to-73000-as-short-squeeze-wipes-out-246m-in-futures-bets/
- https://cryptoslate.com/bitcoin-price-faces-a-crucial-weekend-test-as-us-growth-collapses-to-0-7-while-inflation-stays-stubborn/
- https://coinpedia.org/news/bitcoin-falls-below-71k-after-trump-warns-of-iran-oil-strike-btc-etf-inflow-continues/
- https://www.newsbtc.com/bitcoin-news/bitcoin-fails-to-break-74000-resistance-analyst-predicts-structural-bottom-yet-to-form/


