How Bitcoin Weathered January’s Tariff Shock: Liquidity Hunts, ETF Flows, and Risk Management
Summary
Overview: January’s tariff shock and Bitcoin’s response
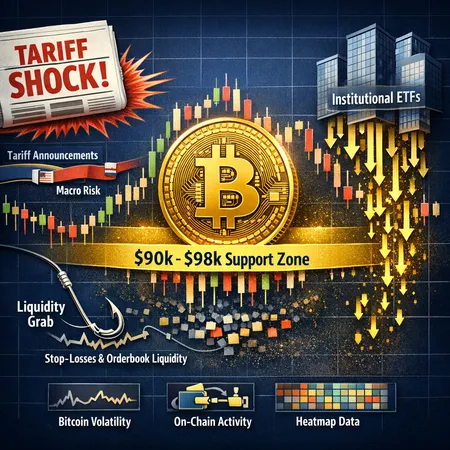
January opened with an unusually high macro cadence — a tariff announcement that rippled through equities, FX and crypto, producing outsized intraday volatility. Headlines linking trade policy to growth expectations sparked margin liquidations that spilled into risk assets, and Bitcoin was no exception. Yet despite violent intraday swings, BTC repeatedly found bids near key psychological ranges (roughly the low‑$90k to high‑$90k band), a behavior worth unpacking for traders and asset managers.
Two forces deserve attention. First, short‑term liquidity structure — where stop losses and limit orders cluster — can create liquidity grabs that amplify moves and define local lows. Second, the persistent inflow of capital into US‑listed spot Bitcoin ETFs has changed how sell pressure is absorbed, reducing tail risk compared with earlier eras. We'll trace the timeline, show the clues on and off chain, and offer practical risk management steps.
For many market participants the easiest starting point is the price action itself: if you study how BTC reacted after headline shocks, you see recurring patterns of aggressive washouts followed by measured recovery. That interplay between stop‑hunting and institutional demand underpins the rest of this piece.
Timeline: headline, price action, and liquidation waves
What unfolded and when
The tariff headlines in January prompted a swift risk‑off impulse across asset classes. Coverage of how trade tensions triggered crypto market volatility and liquidations captured the immediate reaction and helped frame the price moves for traders and desks — see contemporary reporting for the intraday chronology. Daily news outlets documented that US tariff announcements coincided with large BTC moves and concentrated liquidations on derivatives venues.
AmbCrypto and other analysts created a timeline linking the 25% tariff announcement to sharp intraday swings and clustered stop runs, suggesting a causal relationship between the macro update and short‑term order flow. Those write‑ups are useful because they combine price charts, liquidation heatmaps and commentary showing where weak hands were squeezed.
Liquidations, leverage, and the amplification loop
When macro headlines hit, leveraged positions are the accelerant. Futures and perpetual markets executed mass liquidations when BTC broke technical levels, and that selling pressure spilled into spot through arbitrage and exchange flow — a familiar pattern for anyone watching exchange inflows during stress events. Reporting showed outsized short‑term liquidations as traders were stopped out, which then fed into deeper impulse selling before institutional participants and spot buyers stepped back in.
On‑chain signals and the anatomy of liquidity grabs
Where liquidity typically sits
Understanding where liquidity lives is more valuable than guessing direction. Short stops tend to cluster below obvious technical supports and round numbers; longs commonly place stops beneath multi‑day lows or beneath previous breakouts. For Bitcoin, the $90k–$98k band functions as a psychological neighborhood where retail and systematic stops congregate.
On‑chain metrics (exchange inflows/outflows, realized price bands, and the concentration of UTXOs at certain acquisition prices) can flag when sell pressure is likely to be absorbed or amplified. During the tariff episode, exchanges saw transient inflows that aligned with the liquidation window — evidence that leveraged deleveraging contributed to the flash drawdown.
Evidence of local lows and liquidity hunts
Market structure analysts frequently refer to liquidity hunts — deliberate or incidental moves that push price through stop clusters to access resting liquidity (then reverse). Cointelegraph's recent analysis on the possibility of targeted liquidity grabs explains how markets hunt for those stops before reversing, and the January episode displayed hallmarks of such a hunt: quick penetrations of support, large volume spikes, and immediate retracement as buyers replenished bids.
On‑chain traces back the narrative: short‑term spikes in exchange deposit flows, increased derivatives funding volatility, and a jump in realized volatility around the headline timestamp. Those are the fingerprints of a liquidity grab followed by rebalancing flows.
ETF inflows: a counterweight to headline‑driven selling
How spot ETF flows stabilize price
One structural change that matters is the scale and persistence of spot Bitcoin ETF inflows. Recent data showed US‑listed spot Bitcoin ETFs saw their largest three‑month inflow stretch in some time even as trade tensions created a pullback, indicating institutional buyers continued to accumulate during volatility. This inflow behavior functions as a liquidity sink: authorized participants redeem or create ETF shares, and the resulting buy/sell in the open market absorbs pressure.
In practical terms, when ETFs are net buyers they provide steady demand that can clip the tails of headline‑driven sells. Invezz’s coverage of ETF inflows during this period documented a notable increase in institutional flows, which helps explain why recoveries from local lows were comparatively swift: there was a pipeline of capital ready to purchase dips.
The arbitrage channel and market microstructure
ETF creation/redemption mechanics create an arbitrage channel: if the ETF trades at a discount, APs buy spot BTC and create shares; if it trades at a premium, they do the opposite. During the tariff shock, the arbitrage mechanism helped keep the spot and secondary markets more tightly coupled, reducing the likelihood of prolonged dislocations. For asset managers, watching ETF AUM changes and daily net flows is therefore as important as monitoring derivatives funding rates.
How liquidity hunts reshape short‑term volatility
Market structure lessons
A headline‑driven liquidity hunt has three phases: 1) the trigger (macroeconomic news); 2) the execution (penetration of stops and leveraged liquidation); 3) the absorption (institutional/spot buyers step in, often via ETF flows or large OTC bids). Recognizing which phase you're in helps decide whether to reduce risk or prepare for re‑entry.
Cointelegraph’s roundup of liquidity grabs and DailyCoin’s coverage of tariff‑triggered liquidations both highlight that these events are less about fundamentals and more about the microstructure: stops, order‑book depth, and leverage. Once you accept that framing, the response becomes tactical: you either de‑risk into the execution phase or position to buy into the absorption phase.
Cross‑market contagion and risk‑on/risk‑off transitions
Tariff headlines didn’t just affect spot BTC; they pushed around equities, FX and credit spreads, creating correlation bursts. For portfolio managers, that matters because cross‑market hedges (equity puts, FX hedges, or credit protection) can be more effective than crypto‑only measures during macro shocks. DeFi funding dynamics and the behavior of memecoins or NFTs may diverge, but the initial impulse often originates in macro markets before working its way to crypto liquidity pools.
Practical risk management for traders and asset managers
Position sizing and entry discipline
- Size positions with the worst plausible headline in mind: reduce notional exposure when macro risk is elevated. Use smaller initial entries and scale in when liquidity normalizes.
- Avoid one‑shot all‑in entries near obvious round numbers where stop clusters are likely. Layered orders reduce the chance of getting run over by a liquidity grab.
Stop placement and trailing techniques
- Place stops outside obvious liquidity zones rather than immediately beneath multi‑day lows; that reduces the probability of being stopped by a headline‑driven hunt.
- Consider liquidity‑aware stop rules: widen stops during scheduled macro events, or use time‑based exits (e.g., close part of position if price remains below a level for X hours) instead of immediate hard stops.
Hedging with options and cross‑asset instruments
- Options offer asymmetric protection: protective puts or collars can cap downside while allowing upside participation. During heightened tariff risk, implied vol can spike, so tradeoffs exist between hedging cost and protection horizon.
- Consider pairing crypto exposure with cross‑asset hedges (equity index puts or FX hedges) if the portfolio is vulnerable to the same macro shock. That helps when correlation between BTC and equities becomes transiently high.
Monitoring liquidity and ETF flows in real time
- Track spot ETF inflows/outflows and authorized participant activity as a leading signal for institutional demand. In situations where ETFs are net buyers, downside is more likely to be absorbed. The recent three‑month ETF inflow surge is a practical example of this stabilizing effect.
- Use order‑book heatmaps and exchange flow metrics to spot exchange deposit spikes or large resting bids that could either lubricate a recovery or mark the next liquidity trap.
Execution tactics for sideways or mean‑reverting phases
- Use VWAP and TWAP algorithms when executing large buys/sells to avoid moving the market.
- Prefer passive limit executions when the book is thin; only use market takers when liquidity is robust.
Takeaways: reframing volatility as liquidity behavior
Bitcoin’s resilience during the January tariff shock wasn’t magic — it was the emergent result of microstructure interacting with institutional plumbing. Headlines created the trigger, leverage and stop clusters amplified the move into a liquidity grab, and spot ETF inflows helped absorb selling and speed the rebound. For intermediate traders and asset managers, the actionable shift is straightforward: read liquidity, not just price.
Practical rules: map stop clusters and exchange flow, size and hedge with macro risk in mind, and monitor ETF flows as a structural indicator of whether downside will be contained. Integrating these steps into an execution and risk framework will make headline shocks less punishing and more navigable.
Finally, remember that structural changes — like the growth of spot ETFs and evolving on‑chain liquidity — alter the gamebook. Platforms and services across the ecosystem, including those that support trade execution and custody, continue to adapt; Bitlet.app is one example of new infrastructure shaping how participants access crypto markets and services.
Sources
- DailyCoin: Bitcoin plummets as Trump's tariff threats rattle crypto markets
- Cointelegraph: BTC vs new $80k liquidity grab — 5 things Bitcoin this week
- Invezz: Bitcoin ETF inflows hit three‑month high as trade tensions trigger crypto pullback
- AmbCrypto: Breaking down Bitcoin’s volatility after Trump’s 25% tariff announcement
(Also referenced internal context: Bitcoin and how macro shocks can propagate into DeFi markets.)


