Bitcoin Playbook Into the FOMC: EMA Crossover, ETF Flows and 7–30 Day Scenarios
Summary
Executive snapshot
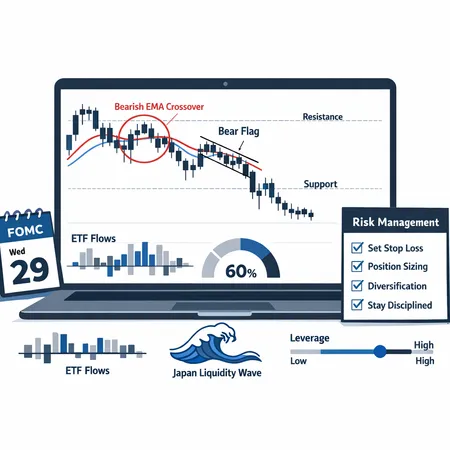
Bitcoin arrives at the FOMC with noisy price structure and asymmetric risk: a bearish weekly EMA crossover (an objective technical warning), patchy ETF flows that could either absorb or accelerate selling, and rising on-chain supply-in-loss that increases the pool of potential sellers. This piece turns those signals into a short-term trader’s playbook for the next 7–30 days: scenario maps, tactical price-action rules, and concrete risk-management guidelines. For many traders who want tools rather than slogans, the steps below are designed to be repeatable and measurable. (If you use tooling to scale buys or manage margin, platforms like Bitlet.app can help with installment buys and position sizing.) Also remember that for context many market participants still treat Bitcoin as the macro beta of crypto.
Market signals: what’s flashing red (and why it matters)
The weekly EMA crossover — history and implications
A weekly EMA crossover (shorter weekly EMA crossing down below a longer weekly EMA) is not an intraday quirk: it represents a change in the medium-term trend. Historically, these crossovers preceded extended pullbacks or multi-week consolidation periods rather than immediate, clean trend reversals. Analysts have flagged recurring EMA crossovers as early warning signs because they coincide with increasing supply sitting at a loss and lower buyer participation. CryptoPotato summarizes how past historic EMA crossovers correlated with meaningful downside pressure and heavier drawdowns, a pattern worth respecting heading into a macro event like the FOMC (see analysis in CryptoPotato).
Why this is actionable: a weekly bearish crossover raises the prior probability of a directional failure on macro shocks. It doesn't guarantee a crash, but it makes shock-driven selling more likely to extend and to create lower swing lows rather than fast snapbacks.
ETF flows and on-chain supply-in-loss: the real liquidity backdrop
ETF flows can absorb selling or become a source of liquidity if authorized participants hedge and create sell pressure in spot/derivative markets. The net effect depends on whether ETFs are experiencing large inflows (providing structural demand) or outflows (forcing redemptions). On-chain metrics show another pressure point: rising supply-in-loss means a larger cohort of holders sitting underwater who are more likely to sell into rallies or to reduce exposure during volatility. The interaction of these two — institutional demand via ETFs versus retail/whale selling from underwater addresses — will determine whether a macro shock results in a shallow pullback or a deeper unwind.
Cointelegraph recently walked through the FOMC calendar and key BTC levels traders were watching ahead of the meeting, underscoring how ETF flow context interacts with macro events to produce outsized moves (see Cointelegraph primer). Meanwhile, past Fed meetings often produce outsized crypto volatility and occasional post‑Fed selloffs, a pattern reviewed in NewsBTC’s look at historical post‑FOMC moves (see NewsBTC review).
Macro scenarios: how the FOMC and global liquidity change the game
Scenario A — Dovish surprise or data that weakens the Fed narrative (Liquidity tailwind)
If the FOMC signals a clear easing in the terminal rate outlook or data materially weakens the Fed’s hawkish stance, liquidity will likely expand across risk assets. In such a scenario institutional flows into ETFs could accelerate, on‑chain realized losses begin to compress as buyers return, and the weekly EMA crossover may get invalidated if price reclaims the relevant EMAs for multiple consecutive weekly closes. Traders should expect strong intraday reversals, rapid mean reversion, and opportunistic long entries into retests of broken resistance.
Tactical posture: bias toward tactical longs on daily reclaim and confirmations (two consecutive daily closes above the short weekly EMA); tighten stops and reduce leverage after a clear reclaim.
Scenario B — Neutral Fed tone but risk‑off markets (Stalled liquidity)
A neutral Fed statement with forward guidance that emphasizes data dependency often leaves markets rangebound and jittery. ETF flows may slow or become mixed while on-chain sellers remain present. In this middle case, expect choppy price action, frequent false breakouts, and higher realized volatility without clear directional follow‑through.
Tactical posture: favor range strategies — fade intraday extremes, trade options premium decay, and use small, nimble position sizes. Avoid adding directional leverage until a clear trend emerges.
Scenario C — Hawkish surprise or strong dollar / rate repricing (Liquidity drain)
A hawkish surprise, explicit tightening language, or stronger‑than‑expected inflation prints will likely trigger risk‑off across assets. Historical patterns show sizable selloffs after some Fed tightening surprises — and crypto has been particularly sensitive to these moves. In this case, ETF outflows can compound selling, and the increased supply-in-loss can accelerate margin-driven liquidations. NewsBTC’s historical review reminds traders that major post‑Fed selloffs are not exceptional in crypto.
Tactical posture: reduce directional exposure, hedge with options (buy puts or convert longs into collars), and widen stop distances for any remaining positions to avoid being picked off by short‑term whipsaws.
Special narrative: Arthur Hayes’ Japan liquidity thesis
Arthur Hayes and other macro commentators have argued that liquidity decisions in Japan (e.g., Bank of Japan policy or fiscal actions) can act as a hidden tailwind for risk assets when global flows search for yield. If Japan’s policy shifts produce new yen liquidity or carry trade flows into risk assets, that could offset some Fed‑driven tightening — effectively muddying the Fed’s local impact with external liquidity inputs. Traders should treat this as a conditional tail: it's not the base case, but if you see yen crosses and Asian flows pick up alongside positive ETF demand, downside risk is materially lower.
Trader’s playbook for the next 7–30 days
Core rules (non‑negotiable)
- Position sizing: max 1–2% of account equity risk per trade for directional leveraged plays; reduce to 0.5–1% during FOMC window. Use smaller notional sizes if implied volatility is elevated.
- Leverage: cut leverage by 50% at least 24 hours before the FOMC, and avoid opening new high‑leverage swing positions within 6 hours of the announcement.
- Stops: intraday trades — initial stop 1.5–4% (market dependent); swing trades — 6–15% depending on timeframe and ATR. Convert stops to mental alerts for large size positions and prefer options hedges where stops are untenable.
- Hedging: use options (buy puts or collars) or inverse ETFs/short futures if you cannot reduce spot exposure fast enough. Hedging is cheaper than forced deleveraging in a swift move.
- Event sizing: reduce new trade size when implied volatility (IV) for BTC options is >55% (an arbitrary but useful threshold); favor non‑directional strategies (strangles, iron condors) if IV is very high and you expect rangebound action.
Tactical triggers and percent-based levels (method first, then examples)
Method: base triggers on moving-average relationships (weekly 21EMA, weekly 50EMA), the daily close relative to the short weekly EMA, and percentage breaches of key support/resistance. Combine with volume and option-premium signals (elevated IV + skew). This gives repeatable, discipline-driven entries and exits.
Practical trigger bands (expressed as percent moves from a trader’s current spot):
- Defensive threshold (short‑term): if price drops >5% intraday on higher-than-normal volume within the 48 hours around FOMC, trim longs by 25–50% and tighten stops. This is the first sign that macro flows are dominating.
- Tactical short trigger: if price breaks and holds below the short weekly EMA on a weekly close and the break is accompanied by negative ETF flow headlines or >7–10% weekly drop, consider small directional short positions or buy protective puts. Keep size small — 0.5–1% risk.
- Critical breakdown (higher conviction short): a weekly close below the longer weekly EMA (confirming the bearish crossover) plus rising supply-in-loss and ETF outflows — move to hedged or flat portfolio, or short with tight risk and defined expiration on derivatives (2–6 week horizon).
- Mean‑reversion long trigger: two consecutive daily closes back above the short weekly EMA, rising on‑chain demand (active address activity or reduction of supply-in-loss), and positive ETF inflow news — re‑establish longs incrementally.
Remember: percent rules scale with account size. If you prefer concrete numbers, convert these percentage thresholds to dollar levels relative to your own base exposure.
Risk-management templates
- Example A (Conservative trader): No more than 2x leverage; risk 1% per trade; close 50% of position on a 5% adverse move; add hedges if adverse move reaches 8%.
- Example B (Aggressive trader): 3–5x leverage only after 48 hours post‑FOMC if volatility calms; use protective puts for >2x positions; cap total portfolio directional exposure at 20% of equity.
- Options play: buy 30‑45 day puts for asymmetric downside protection if you expect a hawkish shock; sell shorter-dated premium only when IV is rich and you can manage assignment risk.
Execution checklist (practical and fast)
- 48–24 hours pre‑FOMC: reduce gross leverage by 25–50%; set alerts at the defensive threshold (5% intraday) and critical threshold (weekly EMA holds).
- Six hours pre‑FOMC: avoid initiating new large directional positions; if necessary, size very small and protect with options.
- On print and first 60–120 minutes: monitor institutional flow/news (ETF net flows, AP activity) and funding rates; widen stops for remaining positions to avoid being whipsawed.
- 24–72 hours post‑FOMC: reassess EMA relationship on daily and weekly closes; only scale into fresh directional positions if the market gives clean technical confirmation (two‑day reclaim or a second weekly close).
FAQ: common trader questions
Q: Should I close all my leveraged longs before the FOMC? A: Not necessarily. If your leverage is modest (≤2x) and you have protective hedges, you can maintain exposure; otherwise reduce size and hedged positions are preferred. The rules above give concrete percent‑based thresholds for trimming.
Q: Do ETF inflows guarantee a floor? A: No. ETFs can provide structural demand, but during risk‑off episodes institutional redemptions and derivatives hedging can create short-term selling pressure. Watch net flows, not headlines.
Q: How should I interpret the weekly EMA crossover if price immediately snaps back? A: Crossovers are probability tools, not certainties. Immediate snapbacks can invalidate short setups, but if the weekly structure remains weak the risk of a renewed failure is higher. Use multiple confirmations (volume, on‑chain metrics, ETF flow data) before pivoting.
Final thoughts — probabilities, not certainties
This FOMC window is a classic example of where technicals (the weekly EMA crossover), liquidity context (ETF flows, on‑chain supply-in-loss) and macro narratives (Fed tone and external liquidity like potential Japan flows) all interact. Treat them as conditional inputs into a probabilistic framework rather than definitive triggers. For intermediate traders that means smaller sizes, clearer stop rules, and explicit hedges during the 7–30 day window. Keep your checklist handy, watch ETF flow headlines, and don’t confuse noise for a trend until price, volume, and on‑chain metrics align.
Sources
- Cointelegraph — Bitcoin eyes 90K: FOMC watch and BTC levels: https://cointelegraph.com/news/bitcoin-eyes-90k-fomc-watch-these-btc-price-levels-next?utm_source=rss_feed&utm_medium=rss&utm_campaign=rss_partner_inbound
- CryptoPotato — Historic Bitcoin crossovers flash warning signals again: https://cryptopotato.com/historic-bitcoin-crossovers-flash-warning-signals-again/
- NewsBTC — Bitcoin braces for FOMC volatility: historical post‑Fed selloffs: https://www.newsbtc.com/bitcoin-news/bitcoin-price-braces-for-fomc-volatility-as-history-shows-major-post%e2%80%91fed-sell%e2%80%91offs/