Stablecoin Health and Liquidity Risk: How a 1% Slip and Tether's CNH Phaseout Could Tighten BTC Markets
Summary
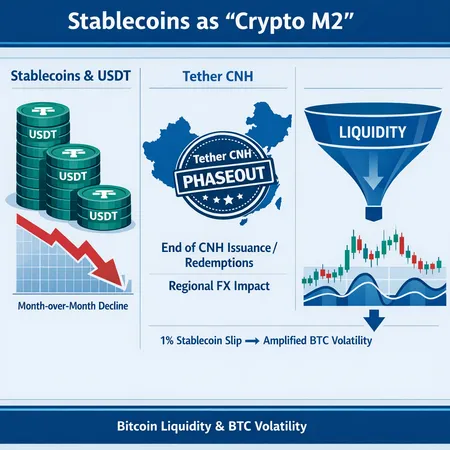
Why stablecoins are crypto’s deployable cash (the ‘crypto M2’)
Stablecoins — principally USDT — have evolved beyond niche settlement tokens into the plumbing that moves fiat‑equivalent liquidity into crypto markets. Market‑makers, OTC desks, exchanges and DeFi protocols rely on stablecoins as an immediately deployable pool of capital: you don’t wait for bank rails; you mint, swap, or transfer. That operational role is why some analysts describe stablecoins as crypto’s M2 — a money‑supply analogue for the ecosystem where marginal changes in supply can ripple into asset liquidity and funding conditions. For a succinct framing of that perspective and a recent empirical read on supply shifts, see the analysis at CryptoSlate.
This matters for Bitcoin because a large share of USD‑denominated flow enters BTC markets via stablecoins. When stablecoin balances tighten, the effect isn’t abstract: it shows up as thinner order books, wider spreads, and larger price impact for big trades. For many traders, Bitcoin remains the primary market bellwether, so changes to the deployable cash behind it are macro‑relevant.
The recent slip in stablecoin supply: small percentage, sizable dollar effect
CryptoSlate flagged a month‑over‑month decline in aggregate stablecoin supply on the order of ~1%. A 1% percentage change sounds tiny — but applied to an aggregate supply measured in the low hundreds of billions, it converts into a meaningful dollar quantity. To put it concretely:
- If global stablecoin supply is in the ~$100–200B range, a 1% decline equals roughly $1–3B of less deployable cash sitting in wallets and contracts.
- Not all stablecoins sit on exchanges or with market‑makers. Industry practice and block‑level flows suggest only a fraction of total supply is “active” on‑exchange at any time — but that fraction is precisely where immediate market liquidity lives.
A one‑month retraction of even a few billion dollars from the deployable pool can nudge market‑making capital to withdraw or tighten inventory, which increases slippage for large spot and OTC trades and raises funding rates in margin markets.
Tether’s CNH decision: mechanics and regional FX fallout
In April–May of the most recent reporting window, Tether announced it would stop issuing and supporting redemptions for CNH‑denominated USDT (offshore Chinese yuan) — a change covered by Coincu and explained further by Blockonomi. In practice this means:
- Offshore CNH <> USDT rails that had been offered to some regional counterparties will be wound down. Desks that used CNH‑paired USDT as a short corridor to move yuan liquidity into stablecoin form must retool.
- Regional FX liquidity implications: CNH corridors often served Asia‑based arbitrage desks and OTC flows that converted local currency business into USDT for global deployment. Removing that native issuance option raises friction onshore/offshore and can increase the time and cost to convert CNH liquidity into global USD‑pegged stablecoins.
You can read the original notices and analysis at Coincu and Blockonomi for the operational and commercial reasoning behind Tether’s move. The key point for market participants: a change in issuance support is not purely symbolic — it alters where stablecoins are created and redeemed, and therefore how regional pools of deployable cash behave.
How a 1% stablecoin slip can tighten BTC liquidity — modeled scenarios
Below are three concrete scenarios, built so treasury managers and researchers can map stablecoin supply shifts into market‑impact outcomes. These are stress illustrations, not predictions, and they illustrate channels and simple arithmetic you can apply to internal books.
Scenario A — The on‑exchange depth squeeze (conservative)
Assumptions:
- Global stablecoin supply = $150B (round number for modelling).
- On‑exchange / deployable share = 10% of total = $15B.
- Observed supply slip = 1% of global = $1.5B.
Mechanics and math:
- If the outflow is concentrated from exchange balances, $1.5B removed from $15B on‑exchange pool = 10% reduction in available on‑exchange stable liquidity.
- Reduction in market depth behaves roughly inversely with price impact: if prior market depth implied a 4% price move for a $500M aggressive buy, a 10% drop in depth raises impact to ~4.44% (4% / 0.9) — a ~11% increase in the expected move.
Why this matters:
- For desks executing multi‑hundred‑million orders, that extra slippage is real P&L; for risk models, realized volatility and margin requirements will spike.
Scenario B — Corridor failure: regional FX + local liquidity shock (targeted)
Assumptions and context:
- A regional corridor (CNH‑heavy flows) supplied 5% of local exchange stable balances via Tether CNH issuance and associated OTC desks.
- Tether ends CNH issuance; redemption windows tighten, and local desks must convert via bank rails or other stablecoins.
Mechanics:
- The on‑the‑ground effect is a localized withdrawal of stable balances on Asia‑based exchanges and desks. Even if global supply is unchanged, local depth is impaired.
- If local Asia‑based visible depth for BTC falls by, say, 15% during the transition, regional orderbooks become more fragile. Large local flows — such as miners selling into regional liquidity or concentrated hedge fund trades — will generate outsized local price moves that can propagate globally through arbitrage.
Practical impact:
- Increased regional volatility and slower bid/ask replenishment. OTC desks widen quoted spreads, and arbitrageurs demand higher compensation to hold inventory.
Scenario C — Funding and leverage feedback loop (amplified)
Assumptions:
- Stablecoin outflows reduce immediate liquidity and increase short‑term funding costs.
- Leveraged positions (perpetuals, margin) are sensitive to immediate liquidity and funding rate moves.
Mechanics:
- Thinner spot liquidity increases realized volatility and the chance of rapid deleveraging. As leveraged traders are forced to cut positions, liquidations create additional selling pressure, which in turn drains more stablecoin cash from market‑making pools as market‑makers step back to protect inventory.
- A feedback loop emerges: lower stablecoin depths → higher impact → more liquidations → further depth reduction.
Illustrative outcome:
- Under stress, a 1% initial supply slip that feeds into funding spikes and liquidations can create a multi‑percent realized drawdown on BTC in hours rather than days. The net effect is non‑linear because of leverage and behavioural thresholds.
What treasury managers and macro researchers should monitor and do
Monitoring
- Track aggregate stablecoin supply metrics and month‑over‑month deltas. Small percentage moves can equal billions of dollars.
- Watch on‑exchange balances and regional concentration. A global stablecoin metric masks local imbalances.
- Follow issuer announcements (for example, Tether’s CNH phaseout covered at Coincu and Blockonomi) because policy changes rewire the issuance/redemption map.
Risk controls and playbook
- Maintain a liquidity buffer in multiple forms: on‑exchange stable balances, bank fiat lines, and alternative stablecoins. Avoid single‑corridor dependency (e.g., heavy reliance on CNH rails).
- Stress‑test: model 0.5–2.0% percents of global stablecoin supply contraction and map to on‑exchange depth scenarios for your target pairs (spot, futures, options).
- Diversify conversion rails: have pre‑qualified OTC partners across regions and multiple stablecoin relationships to avoid a single issuer or corridor becoming a choke point.
Operational notes
- For institutional desks, increase cadence of intraday liquidity checks when supply metrics turn negative. Consider temporary limits on large aggressive flow execution if implied market impact models deteriorate.
- Use spot and derivative hedges preemptively; wider hedging windows during a supply contraction will likely be cheaper than executing large spot trades into a thinning book.
Bitlet.app and other treasury tooling can help monitor stablecoin flow exposures and provide multi‑rail execution options; use such tooling as part of an overall contingency plan rather than as a single remedy.
Closing: small slippages, outsized consequences
Stablecoin supply is not merely an on‑chain statistic; it is an operational input to market liquidity. A seemingly modest 1% month‑over‑month slip becomes meaningful once you translate percent to dollars, and dollars to on‑exchange depth. Tether’s CNH issuance and redemption changes are a concrete example of how issuer policy alters regional corridors and can concentrate liquidity risk. For macro researchers and treasury managers, the practical takeaway is straightforward: measure the deployable cash behind your markets, model supply contractions explicitly, and stress test for corridor failures.
If you walk away with one actionable item: convert percentile supply moves into dollar scenarios for your specific execution footprint — and rehearse the hedge and conversion playbook before the next liquidity squeeze arrives.