Trader’s Guide: Navigating Bitcoin During Extreme Volatility and ETF-Driven Flows
Summary
Introduction — why this regime is different
The current BTC trading regime mixes large, often predictable ETF flows with hyper-levered derivatives markets. That creates fast directional moves and frequent whipsaws where spot liquidity gets swept and derivatives funding/futures flows create cascades. For many traders, Bitcoin is no longer a purely spot-led instrument — price often reflects temporary inventory shifts from ETFs and the pressure of options and futures desks.
This guide focuses on practical, repeatable rules: how to read ETF flow prints and Coinbase premium, choose spot vs derivatives entries, add options hedges for drawdown protection, and manage sizing and stops when volatility spikes. There are concrete setups and a checklist to keep you disciplined when the market feels “controlled by derivatives.”
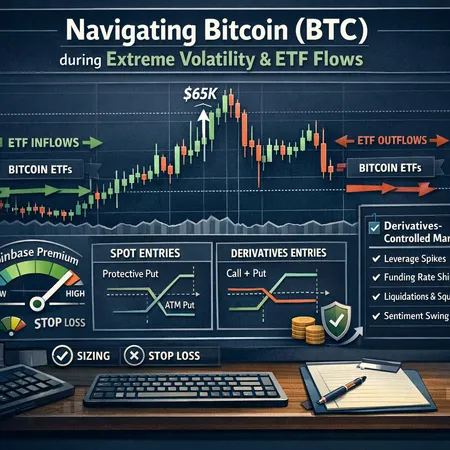
Reading ETF flows and Coinbase premium: what matters and why
- What to watch in ETF prints: weekly net flows (buy or sell), concentration of flows, and whether flows arrive as a steady drip or large lumps. Large outflows or inflows often move spot first because authorized participants need to rebalance inventories.
- Practical thresholds: a sustained weekly net inflow above ~0.5–1% of weekly average traded volume should be treated as structural buying. Conversely, outsized outflows (see the recent weekly net outflows report) often precede selling waves and liquidation cascades.
When ETFs show net outflows, expect short-term selling pressure and lower spot bids; when they show inflows, expect spot demand and a positive basis for ETFs vs spot. A recent report on ETF outflows and price touches is useful context for reading flow-driven moves: Bitcoin ETFs saw weekly net outflows as BTC briefly touched $60K.
- Coinbase premium (USD spot on Coinbase vs other venues): treat it as a real-time proxy for U.S. retail and institutional bid strength. A sustained premium >0.5% suggests aggressive U.S.-based buying; a negative premium hints at local selling pressure or ETF-related selling into U.S. venues.
How to combine them: ETF flows give the directional “why” (inventory flow), Coinbase premium gives the immediate “where” (which venue/region is bidding). If ETF inflows + rising Coinbase premium → higher probability of safe spot entries; ETF outflows + negative premium → treat spot buys cautiously and default to hedged or reduced-sized positions.
Spot vs derivatives entries: frameworks and when to prefer each
- Spot entries (cash Bitcoin): preferred when flows are structural and Coinbase premium confirms demand. Use spot when you want permanent exposure, when funding rates are high and unattractive, or when you expect a slow grind higher.
- Derivatives entries (futures/perps/options): favored for tactical, short-term trades, leverage-efficient plays, and when you can hedge quickly. Use derivatives when you want to express view without landing price risk (e.g., directional short via futures if ETF outflows are surfacing).
Trade decision flow (simple):
- ETF flows trending in same direction as premium? Favor spot build with small incremental buys.
- ETF flows neutral/uncertain and implied volatility cheap? Favor directional via futures or options (clean entry/exit).
- ETF flows show stress (net outflows) + funding skew negative? Reduce spot size and use derivatives hedges.
Practical tip: when entering derivatives, prefer limit orders or take liquidity priced to remove most slippage; trade smaller sizes into high leverage windows (Asian open, U.S. open) to avoid getting torched by liquidity sweeps.
Options hedging: specific ideas for drawdown protection
Options can convert tail risk into a known cost. Choose based on how long you expect the stress to last.
- Protective put (buy puts): Buy 1–2% delta puts as insurance for a spot position. If you hold sizable spot exposure and fear a fast drawdown, a handful of OTM puts buys you a floor. Cost is the obvious tradeoff.
- Put spread (buy put & sell lower put): Cheaper than outright puts; caps protection but reduces premium outlay. Good when you think a drop may be sharp but limited.
- Collars (buy put, sell call): Useful when you want to finance downside protection — you protect against a drawdown while giving up some upside beyond the short call strike.
- Short-dated vega plays: When you expect a short-term directional move and implied volatility is spiking, avoid buying options at high IV. Instead, consider delta-hedged option-selling only if you have capacity and firm risk controls.
Hedge sizing rule of thumb: protect the notional equal to the portfolio’s at-risk dollar amount. Example: if you hold $200k spot and your max drawdown tolerance is 10% ($20k), buy enough puts or put spreads to pay out ~$20k at the stress level you choose.
Practical costs: in volatile ETF-driven regimes, implied vol and skew can blow out — check whether hedging cost is justified versus reducing spot size. Use weekly options for tactical hedges and monthly for structural protection.
Sizing and stop placement in volatility
Position sizing: reduce risk per trade when realized and implied vol are elevated. A practical rule: cut normal allocation by half when 30-day realized vol exceeds a recent baseline (e.g., 30-day > 1.5x 90-day). For aggressive traders cap per-trade risk at 0.5–1% of equity during extreme volatility; otherwise 1–2% is typical.
Volatility-adjusted stops: use ATR-style stops or volatility percentiles instead of fixed dollar stops. Example: place stops at 2–3 * 30-minute ATR for intraday trades, or 3–6 * daily ATR for swing trades. That reduces stop-outs from noise.
Use structural levels as secondary defense: if stops are wide, scale back size. If you must be aggressive, prefer staggered entries and staggered stops (ladder) to manage execution risk.
Leverage limits for derivatives: keep leverage conservative when funding rates and open interest are spiky. A practical max: 2–5x on directional futures for most intermediate traders during this regime. Let professional desk strategies take heavier books.
Trading whipsaws — tactical playbook (Asia-session reclaim example)
Whipsaws often happen when a regional session has low liquidity and a liquidity sweep flushes leveraged positions. A recent fast reclaim in Asia that pushed BTC back to $65K is a textbook example: price flushed leveraged shorts, then jumped as liquidity refilled and momentum flipped (see the session example here).
Tactical rules for whipsaws:
- Wait for a retest: after a dramatic reclaim, wait for price to retest the reclaimed level with lower spread and normal volume before adding size.
- Use micro-sizes initially: trade 20–30% of your intended size on the first confirmation (first retest with volume), scale to full size on second confirmation.
- Spot vs derivatives: prefer derivatives for quick scalps during whipsaw, because you can add and remove exposure faster and hedge instantly. But cap leverage and use tight time stops.
- Watch OI and funding: rapid OI drop with big price move often signals forced deleveraging; don't chase until funding and OI stabilize.
Example plan (Asia reclaim to $65K):
- Price spikes to $65K on low liquidity. Do not buy immediately unless you have a clear order flow signal.
- Wait for a 15–60 min retest to $64.2–64.8K with healthy volume.
- Enter 25% of planned size with a tight stop below the session low; add remaining size on retest-confirmation.
- Hedge with short-dated put or small futures short if the reclaim looks like a liquidity move without ETF/inflow support.
Reference for a rapid Asian-session whipsaw that produced hyper-momentum and a reclaim: news example of Asia whipsaw reclaiming $65K.
Checklist: adapting to a market controlled by derivatives
Use this checklist before every trade when derivatives are influencing price:
- ETF flows: are recent ETF flows net inflow, outflow, or neutral? (Large outflows raise caution.)
- Coinbase premium: positive, negative, or flat? Is premium trending? (A confirming premium boosts spot bias.)
- Funding rate & open interest: are funding rates extreme? Is OI rising or collapsing? (Rising OI with skew often precedes squeezes.)
- Implied vol & skew: is IV elevated? Are PUTs more expensive than CALLs (skew)? (High IV → hedging costlier.)
- Liquidity profile by session: which session provided the move? Was it low-liquidity (Asia) or high-liquidity (U.S.)?
- Order flow / exchange flows: are APs or big desks dumping into spot? Monitor block sizes and exchange flow reports.
- Risk/PnL sizing: does current position size respect the reduced-risk rule for high vol? (Cut sizes if unsure.)
Tick this checklist before committing to new spot or derivatives exposure.
Example trade plan — combining signals into an actionable tactic
Scenario: ETF weekly outflows are rising, Coinbase premium turns negative, funding slightly negative, IV is elevated.
Plan:
- Reduce spot accumulation to zero; close any unhedged add-lists.
- If you want directional short exposure, use futures with a conservative 2x leverage and size to risk no more than 1% of portfolio.
- Buy a put spread as protection for outstanding spot: buy 1% delta 1-month put and sell a deeper 0.5% delta put to reduce cost.
- Place stop-loss for futures at 2.5 * daily ATR; use mental stop for spot and let the put spread cap the tail.
- Reassess after 24–48 hours; if ETF flows continue to show outflows and OI compresses, tighten stops and reduce exposure.
This plan balances a tactical directional view with an options hedge that caps the downside without paying full put premium.
Final notes and operational tips
- Data sources matter: use verified ETF flow reports and watch Coinbase premium live. ETF flows can be delayed, but they still shape inventory and funding dynamics.
- Keep a trading log: record flow reads, premium, funding, IV and outcome for every trade. Over time you'll spot which signals are more predictive for your timeframes.
- Stay operationally ready: in these regimes, execution — exchange connectivity, slippage, and quick hedging — is as important as your directional read.
Bitlet.app users can integrate flow-aware sizing and hedging rules into their risk routines; treat these tactics as templates and adapt to your edge.
Sources
- Analysis of market structure pointing to ongoing selling pressure after BTC slipped below $70K: Bitcoin Market Structure Points to Ongoing Stress.
- Report on weekly net outflows from Bitcoin ETFs and price touches: Bitcoin ETFs weekly outflows and price context.
- Example of an Asia-session whipsaw where BTC reclaimed $65K after leveraged positions were flushed: Asia session whipsaw reclaiming $65K.


