XRP’s Mixed Signals: 7% Weekly Rally vs Collapsing XRPL Payments — What's Really Happening?
Summary
Executive snapshot
XRP has been punching above its weight in the short term: a roughly 7% weekly gain and top‑10 outperformance have attracted attention. At the same time, multiple XRPL‑centric indicators show stress — a startling report of a near 90% collapse in XRPL payment volume over two weeks, localized selling pressure tied to an alleged algorithmic dump into KRW on Upbit, and a community flare‑up over Xaman wallet fees and multisig UX. Reconciling these signals matters: is this a genuine recovery driven by payments and adoption, or a distribution setup masked by market structure? In the sections that follow I unpack price action, on‑chain nuance, exchange flows, wallet controversies and plausible scenarios for what comes next.
Recent price action and technical setup
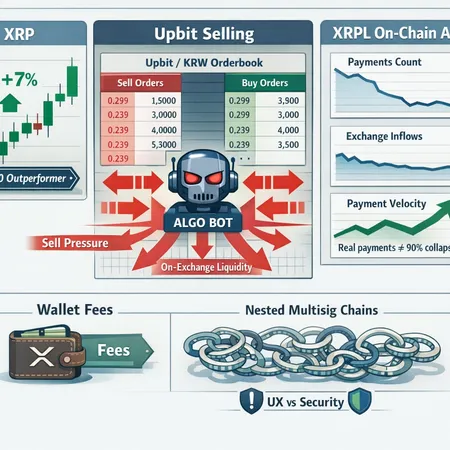
Over the latest weekly window XRP outperformed many peers, posting gains near 7% and drawing headlines on momentum and top‑10 performance. Short‑term technicals show a market trading above key moving averages on higher‑timeframe charts, with momentum oscillators back into neutral‑to‑bullish territory. As BeinCrypto noted, price momentum has been a supporting narrative for speculators and longer‑term traders alike (BeInCrypto analysis).
From a trader’s perspective, the setup can be read two ways:
- Bull case: sustained closes above short‑term moving averages and a breakout of recent consolidation could invite momentum buyers and a re‑test of multi‑week resistance. Rising derivatives funding or declining borrow demand would support continuation.
- Bear case: on‑exchange concentration, heavy localized selling, or waning on‑chain utility could make the current bounce a technical rally within a larger distribution range — a classic fade opportunity if buyers lack conviction.
Watch key levels (short‑term moving averages, prior accumulation zones, and major resistance) and liquidity depth on major venues. For many traders, XRP remains a cross‑market proxy, so cross‑exchange spreads and KRW/USDT pairs are especially revealing.
The XRPL payments collapse story — what was reported and what it means
A viral report claimed XRPL payments volume cratered by nearly 90% over two weeks. The raw headline is alarming: if the ledger’s payments dry up, the narrative of XRP as a bridge asset or payment medium weakens. The U.Today piece covering the drop framed it as a sharp, near‑term contraction in reported payments on XRPL (U.Today report).
But measurement matters. "Payments volume" is not a unitary metric — it can mean the number of payment transactions, nominal value transferred, or a specific subset of transactions counted by a given index. A few important nuances:
- Short windows amplify noise. Two‑week snapshots can reflect temporary routing changes, congestion, a major bridge operator pausing, or a single large trader shifting flows off‑chain.
- Payment counts vs payment velocity diverge: a lower raw count can coexist with higher velocity if the average value per payment rises or if off‑ledger settlement complements on‑ledger finalization.
- Destination matters: XRPL is often used as a bridge between fiat rails and other crypto rails. If liquidity providers consolidate flows or change pooling strategies, on‑chain traces can briefly vanish without real user demand fading.
There are also counterpoints that suggest continued real usage. CoinPaper recently framed XRP’s role as an effective on‑chain bridge asset for XRPL activity, arguing that XRPL’s utility persists in cross‑border and on‑chain settlement scenarios even if some metrics dip (CoinPaper analysis). That argument centers on use cases rather than raw transaction counts — and for markets, utility often matters more than a single volatility‑prone metric.
Upbit, KRW flows and the alleged algorithmic seller
Coverage in recent days has focused on an alleged algorithmic seller on Upbit — a Korean exchange known for concentrated KRW liquidity in XRP pairs. The Cryptonomist investigation claims a persistent algorithmic seller dumped ~3.3 billion XRP on Upbit, a move that would heavily distort local order books and on‑exchange balances (Cryptonomist analysis). NewsBTC and other outlets also flagged on‑exchange outflows and concentrated selling dynamics tied to Korean markets (NewsBTC coverage).
Why this matters:
- Localized selling can depress on‑exchange liquidity in a major fiat corridor (KRW), creating visible supply pressure even while global AMM or OTC demand buys elsewhere.
- Algorithmic or programmatic sellers often target venues with shallow book depth to achieve scale without moving larger global prices — the result is sharp localized volatility, wider spreads, and the illusion of weaker demand.
- Exchange outflows tied to coordinated selling reduce available inventory for market makers and retail buyers, compressing liquidity and elevating slippage for large purchases.
In short: Upbit selling may explain why on‑exchange balances and visible price action in KRW pairs look worse than broader market momentum would suggest. That doesn’t prove global demand is absent — but it does raise the probability that some of the rally is being absorbed by algorithmic buyers elsewhere while Korean sellers press prices locally.
The Xaman wallet fees / nested multisig controversy: UX, security and adoption
Technical and UX debates matter for adoption. A recent community backlash over Xaman wallet fees and nested multisig setups drew a public response from Ripple’s CTO Emeritus, highlighting the tensions between low‑fee design, multisig security, and user friendliness (U.Today coverage).
Why a wallet fees spat can move markets:
- Wallet friction raises the activation energy for new users and institutions. If custodial flows or UX issues make settling on XRPL less convenient, on‑chain payment velocity can suffer even if macro demand exists.
- Multisig and nested multisig architectures add security but can complicate fee estimation, recovery flows and day‑to‑day operations for liquidity providers or exchanges.
- Community trust matters: sustained public disputes may encourage migration to alternative rails or delay integrations that would otherwise generate steady payment throughput.
Put simply, UX/security tradeoffs are not purely technical — they influence adoption curves, which in turn affect both real payment velocity and market narratives.
Reconciling a price rally with degraded on‑chain activity: plausible scenarios
Here are realistic scenarios that tie together the rally and the on‑chain stress signals. I assess each with a short probability/impact lens for intermediate investors.
- Genuine demand with measurement distortion (Medium probability)
- What: Real cross‑border and bridge demand persists, but short‑window metrics (like a two‑week payment count) temporarily undercount activity due to routing or aggregator changes.
- Impact: Price can sustainably appreciate if liquidity scales and adoption continues.
- Watch: Average value per payment, operational updates from major liquidity providers, XRPL gateway activity.
- Localized distribution + global accumulation (High probability)
- What: Concentrated sellers on Upbit depress KRW liquidity while whales and OTC desks accumulate elsewhere, producing a split signal of rising price and weak on‑chain metrics.
- Impact: Volatility and divergence across venues; sudden squeezes if on‑exchange inventories dry.
- Watch: Exchange reserves by venue (especially Upbit), cross‑exchange spreads, evidence of OTC fills.
- Short‑term speculative momentum (Medium–High probability)
- What: Technical breakout and momentum trading drive prices, independent of payment usage; if momentum fades, price may retrace harshly.
- Impact: Rapid gains followed by quick reversals; risk of distribution trap.
- Watch: Derivatives funding, open interest, liquidations, and whether price moves are accompanied by higher on‑chain settlement.
- Distribution trap with coordinated selling (Medium probability)
- What: Large holders or algorithmic sellers strategically force volatility to shake weak hands while moving inventory off‑chain.
- Impact: Rally appears on charts but is a false recovery; eventual wipe‑out when demand thins.
- Watch: Large sell‑side flows, sudden on‑chain outflows to unknown wallets, and declines in long‑term holder accumulation.
- UX and fees slow adoption (Lower probability but structural)
- What: Wallet fee disputes and multisig complexity reduce new integrations, throttling longer‑term payment velocity.
- Impact: Even if price rallies, the fundamental adoption thesis weakens over time, capping potential upside.
- Watch: Developer tooling, wallet adoption rates, public statements from gateway operators and custodians.
Practical indicators to watch (and how to use them)
If you’re deciding whether to participate or trim exposure, monitor these metrics closely:
- Exchange reserves by venue (Upbit in particular): declining supply on an exchange with active selling suggests either distribution or accumulation off‑board.
- Cross‑exchange spreads and pair divergences (KRW vs USDT/USDC): persistent spreads imply localized liquidity issues.
- XRPL payment counts vs nominal value per payment and unique sender/receiver counts: divergence between count and value signals changes in usage patterns.
- Large outbound on‑chain flows and cold wallet accumulations: look for accumulation in long‑term custody.
- Derivatives open interest and funding rates: imbalance can presage squeezes or unwinds.
- Community and developer signals: wallet updates, multisig tooling improvements, and statements from major market participants.
These indicators together form a mosaic — no single one is decisive, but consistent signals across them build conviction.
Takeaways and tactical posture for intermediate investors
- Don’t treat the 90% payments headline as definitive on its own. Metrics need context; short snapshots can mislead.
- The Upbit/KRW selling reports are material. Localized algorithmic selling can create large distortions in on‑exchange liquidity and price discovery — track exchange‑level reserves.
- UX controversies like the Xaman fee row are non‑trivial. They influence adoption pathways and can suppress steady payment velocity even while price momentum persists.
- Consider a balanced tactical posture: if you’re long, stagger entries (dollar‑cost average), define stop zones around liquidity clusters, and size positions for higher volatility. If you’re trading, watch derivatives skew and cross‑exchange arbitrage for signs momentum is genuine.
Platforms such as Bitlet.app that offer installment and P2P services are part of the broader on‑ramp landscape; changes in wallet UX or exchange liquidity can affect on‑ramp behavior and payment velocity indirectly.
Final thought
XRP today is a study in contrasts: price strength and headline momentum on one hand, and fractured on‑chain/venue signals on the other. That contradiction is not unique to XRP — it’s a frequent feature of markets where liquidity, UX and concentrated flows interact. For intermediate investors the task is to triangulate across exchange flows, XRPL usage metrics, wallet and infrastructure developments, and price/derivatives behavior. Do that, and you move from reacting to headlines to making informed, probabilistic bets.
Sources
- https://beincrypto.com/xrp-price-prediction-rally-or-crash/
- https://u.today/xrp-ledger-gradually-loses-90-of-payments-volume-in-two-weeks?utm_source=snapi
- https://en.cryptonomist.ch/2026/02/18/upbit-xrp-analysis/
- https://www.newsbtc.com/xrp-news/korean-xrp-exchange-data/
- https://u.today/what-did-i-do-ripple-cto-emeritus-reacts-to-xrp-communitys-rage-against-wallet-fees?utm_source=snapi
- https://coinpaper.com/14704/xrp-solidifies-its-role-as-xrpl-s-ultimate-on-chain-bridge-asset?utm_source=snapi