Solana After the Sell-Off: Trendline Break, $74 Test vs $50 Risk and Trade Plans
Summary
Executive summary
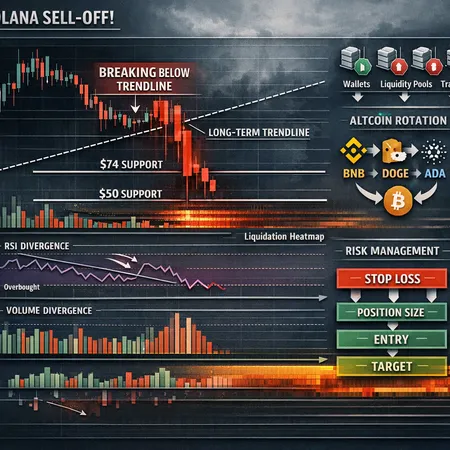
Solana's recent collapse ended the structural uptrend after a decisive break through a persistent ascending trendline. In the immediate term $74 is the make-or-break area: a confirmed hold opens a higher-probability mean-reversion bounce, while a breakdown and drop in liquidity could accelerate a move toward $50. This article unpacks the technical facts behind the trendline break, the on-chain and liquidity drivers amplifying downside, and how SOL fits into a broader altcoin rotation that has seen tokens such as BNB, DOGE and ADA outperform Bitcoin recently.
I draw on price structure, metric-based clues, and flow context to produce concrete trade frameworks — entries, stops, sizing and contingency checks — for active altcoin traders. For traders using platforms like Bitlet.app, these frameworks translate strategy into execution-ready rules.
The technical picture: trendline break and immediate structure
A clean trendline break changes the probability map. For weeks SOL respected an ascending trendline that defined higher highs and higher lows; the recent aggressive sell-off produced a close below that line and a compressing range near the $74 area. Market commentary has described the situation as SOL being “trapped in a tight range” after the sell-off, which matches the technical consolidation after the break (see additional reporting on the sell-off and tight-range action).
- Daily structure: close below the ascending trendline constitutes a structural regime shift from uptrend → range/bearish. A series of lower highs on the 4H confirms the sellers' edge.
- Volume: the break occurred on above-average sell-side volume, followed by lower-volume stabilization — typical after directional conviction moves.
- Momentum: common oscillators (RSI/MACD) show loss of bullish momentum and frequent bearish cross confirmations on multi-timeframe checks.
For further reading on the tight-range price action immediately after the sell-off, see the coverage here: Solana trapped in a tight range after a massive sell-off.
Trendline-break diagnosis: retest or follow-through?
When a trendline fails there are two high-probability market reactions: a retest of the broken structure that rejects and continues the new bias, or an immediate follow-through that squeezes liquidity below obvious support points. Important clues for which path plays out:
- How price reacts on a retest — weak rejection (quick fade) favors continuation lower; strong rejection with higher volume suggests a bull reclaim attempt.
- Orderflow around the trendline — visible resting bids or aggressive asks on order books indicate professional participation.
- Options/derivatives skew or sizable stop clusters below $74: if stops are stacked, a spike lower becomes more likely.
If the retest fails and price is rejected beneath the trendline, a short with a tight stop above the retest high is a clean directional plan. If price reclaims and closes above the trendline with volume, the break is likely a false break and the path to recovery becomes viable.
Support levels: testing $74 vs the deeper $50 scenario
Define levels as zones rather than single pixels. Key structural levels to watch:
- $74 — immediate horizontal zone where buyers previously stepped in; psychological and recent range support.
- $60–65 — intermediate liquidity gap and prior consolidation low; break here signals more technical damage.
- $50 — deeper downside target and the next area where longer-term holders may accumulate; also a round-number magnet.
Scenario A — $74 holds
- Price stabilizes with tightening range, rising on-chain activity (transactions, DEX volumes) and restoring liquidity. A successful hold should show improving bid strength and contraction in realized volatility. Trade approach: small, scaled longs or mean-reversion trades with tight stops beneath the low of the consolidation. Target prior micro-resistances (trendline now as overhead supply) and taper size as price approaches trendline.
Scenario B — $74 breaks decisively
- A decisive break of $74 with elevated volume typically seeks liquidity lower; $60 then $50 become the logical stops for short- and medium-term bulls respectively. The move to $50 is not guaranteed but becomes a high-probability path if liquidity thins and large sellers persist. Trade approach: establish shorts on failed retests of $74 with stops above the retest high; use scaling to average into momentum.
Read the structure as a probability distribution: the break widened the left tail (deeper downside risk), so reward-to-risk requirements for longs must be adjusted accordingly.
Why is SOL weak? Drivers behind the sell-off
Three concurrent forces explain the magnitude of the drop: deteriorating on-chain metrics, squeezed liquidity / institutional flow dynamics, and narrative fatigue that reduces willing marginal buyers.
On-chain metrics
On-chain data often lags price but offers durable signals about participation and protocol health. For SOL, traders should watch: active addresses, daily transaction counts, DEX volumes, TVL trends and staking flows. Deterioration in these metrics — fewer active wallets, declining TVL or falling DEX volume — points to lower native demand and a thinner buyer base during drawdowns.
When on-chain participation falls, volatility tends to skew downward for rallies (they become weaker) and upward for sell-offs (washouts happen faster). I recommend pairing on-chain checks with order book liquidity checks before committing sizable long risk.
Liquidity and market structure
Crypto rallies and crashes are amplified by where liquidity sits. SOL has pockets of thin markets on lower-liquidity venues and large position holders whose rebalancing can create cascades. During a fast sell-off, stop clusters below key levels and insufficient bid depth enable quick drops that skip multiple support bands.
Active traders should monitor on-chain exchange inflows/outflows (CEX deposit spikes), open interest across futures platforms, and concentration metrics — large holder selling is often the fastest route from $74 to $50.
Narrative fatigue and rotation
Narrative cycles matter. Solana’s narrative (speed, low fees, NFT/DeFi activity) has been tested by earlier network episodes and shifting capital preferences. After a strong run in altcoins, traders often rotate capital into different narratives — exchange-native tokens (BNB), memecoins (DOGE), or brands with renewed catalysts (ADA upgrades). That rotation is visible in recent performance: several large-cap alts have outperformed Bitcoin and attracted more flow in the short-term, which can starve SOL of the marginal liquidity it needs to defend levels.
Coverage on recent altcoin outperformance puts this into context — large-caps like BNB, DOGE, ADA and others have seen meaningful rotation flows that change relative strength dynamics and capital allocation among alts: Altcoins outperforming Bitcoin and the beginning of rotation context.
Altcoin rotation: where SOL sits relative to BNB, DOGE, ADA
Rotation into perceived safer or more liquid alt bets (BNB for exchange utility, DOGE for retail momentum, ADA for protocol upgrades) reshuffles demand. Practically, this means:
- SOL can suffer temporarily even if fundamentals are unchanged, because capital is limited and directionally chasing newer themes.
- Traders should measure SOL's relative strength versus a basket (SOL/BNB, SOL/ADA) to spot when SOL becomes oversold and attractive for mean reversion.
Relative strength divergence is a useful early signal: if SOL is collapsing while BNB and ADA are rallying on on-chain/User metrics, look for re-allocation risk back into SOL when it posts leading improvement in metrics or when macro catalysts shift.
Actionable trade frameworks (entries, stops, size)
Below are pragmatic frameworks you can apply immediately. These rules prioritize predefined dollar risk, stop discipline, and contingency plans.
Short (momentum continuation) framework
- Setup: price fails the retest of the broken trendline / $74 and shows bearish micro-structure (lower highs, stronger sell volume).
- Entry: enter short on a bearish 4H retest rejection (e.g., market sell after small wick rejection).
- Stop: place stop above the retest high or cluster of recent highs + spread (typically 1–1.5x ATR at your timeframe).
- Target(s): partial take-profit at $60–65, then $50 as final target. Scale out in 25–50% tranches.
Example sizing: with $100,000 capital, risking 1% ($1,000). If entry = $70 and stop = $76 (risk $6), size = $1,000 / $6 ≈ 166.6 SOL-equivalent exposure.
Long (mean-reversion) framework
- Setup: $74 holds after a low-volume washout, on-chain liquidity improves and price forms higher low with shrinking realized vol.
- Entry: scale into small size near $74 with buy-limit orders and add on confirmation (e.g., 4H close above a shorter-term moving average + rising volume).
- Stop: tight stop below the recent low or beneath $74 zone (size dependent).
- Target(s): first target at the now-resistance around the broken trendline, secondary trim at previous swing highs.
Rule of thumb: reduce position size compared to a trend-following long pre-break; the risk environment is asymmetric — downside tail is larger.
Risk management and position sizing
- Dollar-risk-first: define the dollar amount you can lose on the trade (1–2% typical).
- Use ATR-based stops: match stop width to market noise and calculate contract size accordingly.
- Limit leverage: if using futures, keep leverage conservative (≤3–5x) during regime transitions.
- Margin of safety: leave buffer for slippage and execution fees, especially on sudden volatility.
Option adjuncts and hedges
For larger exposures, consider buying protective puts or constructing collars to limit downside while keeping upside. Options allow asymmetric exposures with defined risk, useful when the technical edge is moderate but distribution risk is high.
Checklist and live-monitoring triggers
Before taking or adding to positions, verify these items:
- Price action: higher-timeframe close above/below your confirmation level (trendline or $74).
- Volume confirmation: follow-through volume on the direction you expect.
- On-chain liquidity: stable or improving active addresses, reduced CEX inflows.
- Derivative flow: no sudden blowout in open interest or skew that implies hidden gamma squeezes.
- Macro/catalyst watch: major macro moves or sector-specific news that could re-allocate capital (e.g., regulatory rulings, major upgrades).
If any of these checks fail, reduce size or stay flat.
Conclusion
Solana’s trendline break materially shifted the trade-off between risk and reward. $74 is the immediate pivot: if it holds in concert with improving on-chain liquidity, measured longs can make sense; if it fails decisively, the path toward $50 is credible and should be traded as a momentum short with disciplined size and stops. The broader alt rotation into BNB, DOGE and ADA changes relative demand for SOL, and active traders should couple technical rules with flow and on-chain checks to remain adaptive.
Use the rules above as frameworks, not absolutes — adapt entries and stops to your timeframe and portfolio risk. For execution, integrate orderbook visibility and on-chain flow data into your pre-trade checklist and monitor evolving altcoin rotation signals.
Sources
- Solana price action and tight-range context: Solana trapped in a tight range after a massive sell-off
- Altcoin rotation and comparative outperformance (BNB, DOGE, ADA context): Altcoins outperform Bitcoin after macro/legal catalyst