Reconciling the Bitcoin ETF Paradox: $53B Cumulative Inflows vs Recent Outflows
Summary
Executive snapshot
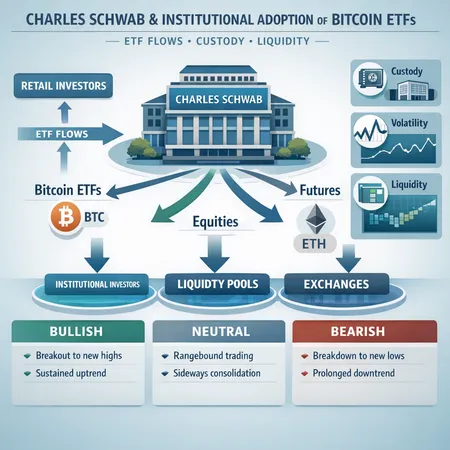
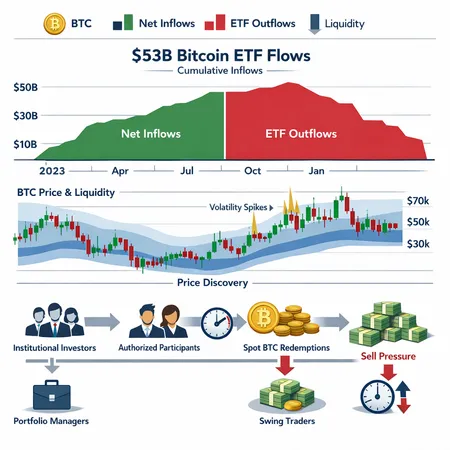
U.S. spot Bitcoin ETFs have catalyzed institutional entry into BTC: cumulative net inflows sit near $53 billion, even as the products periodically register sizable outflows. That apparent paradox—strong long‑term conviction alongside episodic redemption pressure—matters because ETF mechanics can either dampen or amplify spot market moves. This piece reconciles the chronology of flows, the drivers behind the sharp January pullback, how redemptions interact with spot selling, and practical rules for sizing around ETF liquidity events.
Flow chronology and the $53B picture
Since approval, U.S. spot Bitcoin ETFs attracted large and steady allocations from institutions and intermediaries, which together account for the roughly $53B cumulative net inflows reported across independent trackers. Multiple outlets confirm this aggregate figure Cointribune reports the $53B milestone and an independent tally echoed the estimate as well (see Coincu).
That long‑run number is an accumulation: creations minus redemptions since inception. On a day‑to‑day basis, however, inflows ebb and flow. For example, January recorded the largest single pullback of $1.6B for the cycle, a reminder that cumulative conviction can coexist with acute, concentrated outflows (Coinpedia reported the January number).
How ETF mechanics propagate into the spot market
Understanding whether ETF outflows cause spot selling requires unfolding the creation/redemption plumbing and the role of Authorized Participants (APs) and market makers.
Creation: When demand exceeds supply, APs create ETF shares by delivering BTC (in‑kind) or cash to the ETF sponsor. New ETF shares then supply secondary markets without necessarily increasing sell pressure if the BTC used was sourced from existing inventories or OTC desks.
Redemption: When investors redeem, APs can request BTC (in‑kind) or cash. If redemptions are settled in BTC and the receiving AP or market maker chooses to hold that BTC, there is little immediate spot selling. But if the AP needs cash or reduces inventory, they may sell into spot, increasing spot supply and downward price pressure.
Arbitrage & spread compression: Market‑makers and arbitrageurs keep ETF price tethered to NAV by trading ETF shares vs. underlying BTC. Healthy arbitrage activity normally limits persistent premiums/discounts, but during stressed outflows the arbitrage channel can flip from stabilizer to amplifier if APs need to liquidate quickly.
OTC vs exchange impact: Much of institutional execution occurs OTC. Large redemptions are often absorbed off‑exchange, which reduces visible on‑exchange selling but can still drain OTC bids, widen spreads, and shift liquidity bands.
In short: not every ETF outflow equals an immediate sell order on Binance or Coinbase—yet large, concentrated redemptions, especially when APs lack inventory or when market‑wide liquidity is thin, frequently transmit to the spot order book.
What drove the January $1.6B outflow? (drivers and anatomy)
Several forces typically stack to produce a monthly outflow like January’s $1.6B:
Profit taking after a rally. Institutional investors who rode recent gains may monetize via ETF shares to avoid custody or tax complexity.
Rebalancing and risk management. Multi‑asset funds rebalanced after year‑end or rotated into other asset classes, producing coordinated sell orders.
AP inventory and funding pressures. Authorized Participants adjust inventories for capital efficiency; if they shrink BTC buffers, redemptions force spot selling.
Market‑structure and volatility spikes. Episodes of equity or rates volatility can prompt rapid deleveraging. When correlated markets move unfavorably, APs and quant desks may reduce exposure across the board.
Arbitrage and FX/tax timing. Local tax windows, month‑end flows, or FX hedging behavior can make certain months more vulnerable.
January’s number likely reflects a combination of these factors rather than a single trigger. The headline $1.6B outflow is notable as a timing risk signal—not necessarily a reversal of institutional conviction, but an acute liquidity event.
How ETF redemptions feed into price discovery and liquidity bands
Price discovery in BTC is now jointly formed across exchanges, OTC desks, and ETF creation/redemption channels. The presence of ETFs tightens the link between institutional flows and spot prices in several ways:
Narrower long‑term spreads: The arbitrage mechanism generally reduces persistent premiums/discounts and improves the integration of large buyers/sellers into price formation.
Higher baseline liquidity: Cumulative inflows mean more custody and market‑maker inventories are professionally managed, which can deepen markets in normal conditions.
Widened short‑term bands during stress: Paradoxically, when redemptions cluster, observed liquidity on public order books can dry up and spreads widen. That produces larger price moves for equivalent volumes—what traders call wider liquidity bands.
Bid‑ask asymmetry: If APs and custodians prefer to settle redemptions via OTC sales, visible exchange depth might show less supply even while systemic liquidity is being consumed off‑exchange.
Net effect: ETFs improve price discovery over months and quarters but increase the potency of concentrated flows. Large redemptions can create transient dislocations where the exchange price moves more than implied by fundamentals, then reverts as arb activity and new flows step in.
Practical rules for sizing positions around ETF liquidity events
For portfolio managers and swing traders, abstract theory must map to concrete sizing rules. Below are pragmatic guidelines you can apply and stress‑test against your mandate.
High‑level principles
- Prioritize liquidity-adjusted position sizing, not nominal exposure.
- Expect deeper, slower liquidity during concentrated ETF outflows; treat them like supply shocks.
- Hedge actively if your position size could be painful to unwind over one or two ADV (average daily volume) windows.
Rule set (actionable):
ADV‑based cap (swing traders): Limit entry size to a fraction of 1‑day ADV. Conservative: ≤ 1% of daily BTC ADV; Balanced: 1–5% of ADV; Aggressive: up to 10% of ADV if you have hedges. This reduces slippage risk if ETF redemptions push spreads wide.
Portfolio manager liquidity buffer: For larger allocations, require the position to be liquidatable within X days under stressed conditions. Example: ensure full liquidation in 5 trading days at no more than 2x normal slippage. Translate into max position = (daily liquidity × days × slippage tolerance).
Premium/discount throttle: If ETF premium (or discount) moves beyond historical percentiles (e.g., 95th percentile of typical premium), avoid initiating large positions until arbitrage normalization or AP inventory signals stabilize.
Pre‑event haircut rule: Around known liquidity windows (month‑end, quarter‑end, tax windows) trim new exposure by 25–50% unless you have explicit liquidity guarantees from counterparties.
Hedge-to-rebalance rule: If position > target and ETF outflows spike, hedge part of the exposure using futures (size at least equal to the fraction of the position likely impacted by outflows). For example, hedge 30–70% depending on risk tolerance.
Scale‑in/scale‑out discipline: Break trades into N tranches (N≥3) and execute using TWAP/VWAP to avoid giving APs a single event that forces reactive selling.
Maximum drawdown guard: Set hard stop rules tied to liquidity metrics (e.g., tighten stops when implied liquidity cost > 1.5x historical) rather than absolute price levels.
These rules are starting points. Backtest them against past ETF flow events and your own operational constraints.
Monitoring signals and checklist
To detect ETF‑driven liquidity stress early, monitor these indicators daily:
- ETF net flows (daily and cumulative) and 7‑day moving average.
- ETF AUM and AP inventory reports (when available).
- ETF premium/discount to NAV and intraday divergence.
- Spot exchange depth and time‑weighted spread metrics.
- OTC desks’ quoted sizes and bid/ask slippage for large blocks.
- Macro risk indicators (rates, equity vol) that correlate with deleveraging.
Platforms like Bitlet.app and institutional data providers can surface inflow/outflow ticks quickly; integrate those into your execution algos or trading dashboards.
Putting it together: conviction vs timing risk
The $53B cumulative inflow figure demonstrates structural institutional demand for Bitcoin. That’s a long‑term positive for adoption, custody infrastructure, and the depth of professional liquidity. But charting conviction onto shorter time horizons misses the key lesson: timing and concentration risk matter.
Large redemptions—like January’s $1.6B outflow—are not a repudiation of the investment thesis; they are episodic liquidity shocks that test market plumbing. For risk managers and active traders, the right approach is to respect both narratives: acknowledge the durability of institutional demand while designing sizing, hedging and monitoring frameworks that survive concentrated ETF liquidity events.
Conclusion
U.S. spot Bitcoin ETFs reconcile a durable institutional bid (the $53B cumulative inflows) with recurrent short‑term outflows because of how creations/redemptions, AP behavior, and arbitrage interact with OTC and exchange markets. The practical takeaway: treat ETFs as a stabilizer for long‑run price discovery but as a potential source of short‑term liquidity stress. Manage position sizes relative to realized liquidity, watch ETF flow signals, and use hedges and execution tactics to reduce slippage during redemptions.