On‑Chain
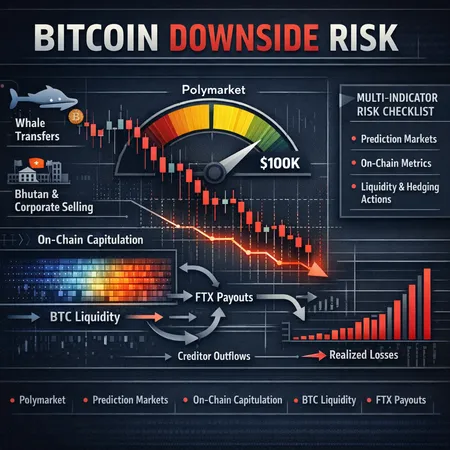
Prediction markets, on‑chain capitulation signals and looming liquidity flows from FTX creditor payouts are converging to raise downside risk for BTC in 2026. Intermediate traders and portfolio managers should use a multi‑indicator checklist to adjust sizing and hedges.
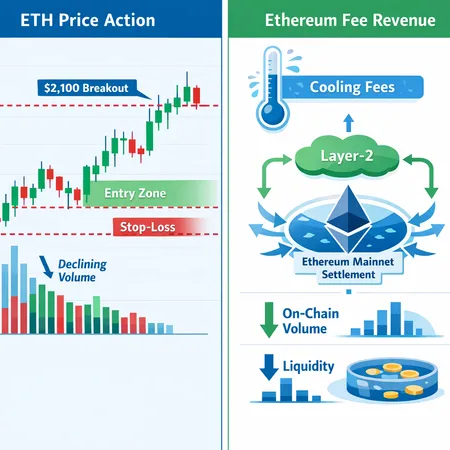
ETH rallied above $2,100 only to stall as volume and fee revenue cooled — a key test for the ‘high‑value settlement’ thesis and whether Layer‑2 settlement flows can sustain on‑chain monetization.
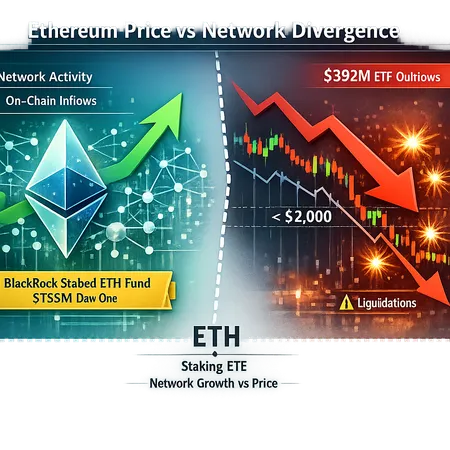
Ethereum’s network metrics show renewed activity and institutional staking demand even as ETH price slipped below $2,000. This article dissects the forces—BlackRock’s staking inflows, stablecoin and L1 activity, ETF outflows and liquidations—and the indicators that will decide whether price eventually follows fundamentals.
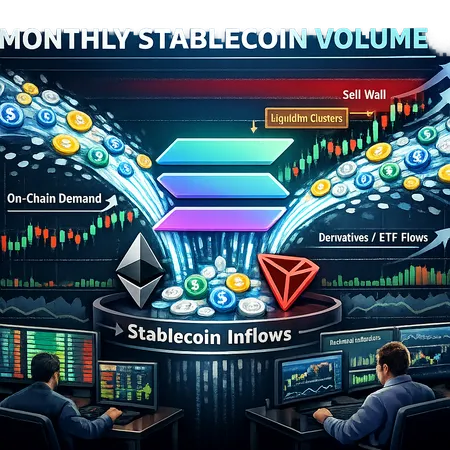
Solana’s recent milestone — surpassing Ethereum and Tron in monthly stablecoin transaction volume — underscores growing on‑chain demand but coincides with mixed derivatives and ETF flows. Traders should weigh stronger retail activity against technical liquidity clusters and sell walls when sizing short‑term SOL trades.
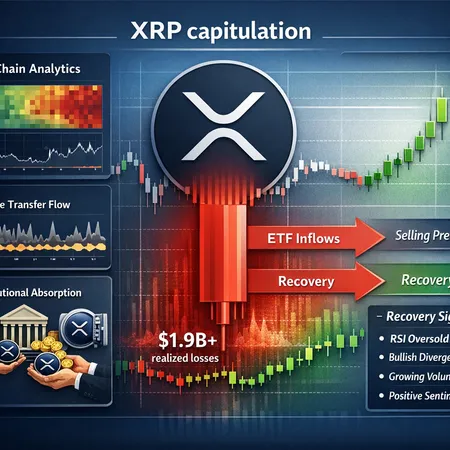
XRP’s on‑chain realized losses surged to roughly $1.9B in a single week — the largest weekly spike since 2022. This article parses the on‑chain signals, institutional absorption, and ETF dynamics to decide whether this is capitulation or the set‑up for a rebound, and offers risk‑adjusted trading strategies.
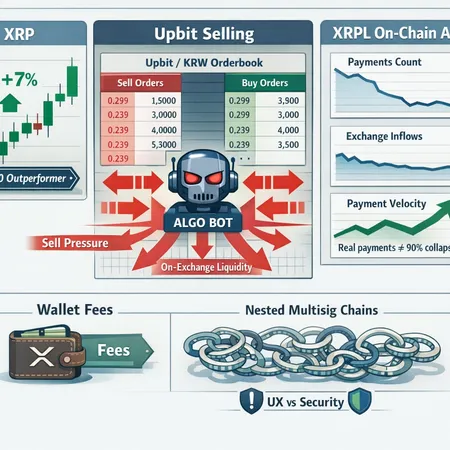
XRP has been a top‑10 price outperformer, yet XRPL payment volume, exchange flow data and community disputes paint a stressed picture. This article unpacks the technicals, on‑chain metrics, Upbit selling reports, the Xaman wallet fee row and scenarios that reconcile the rally with degraded on‑chain activity.

A pragmatic look at how bullish long-term narratives for Bitcoin can coexist with current on‑chain indicators that warn of near‑term volatility, and what investors should do about it.
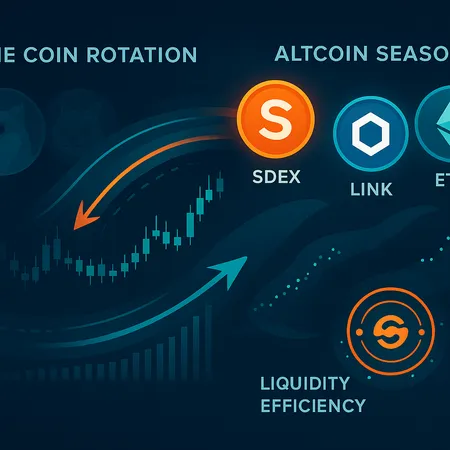
Capital rotation is reshaping altcoin season: legacy meme leaders DOGE and SHIB are losing share while new meme winners and select alts like SDEX, LINK, ETH, SOL and AVAX attract fresh flows. This article explains why, with case studies and a practical framework to separate durable rerates from short‑lived pumps.
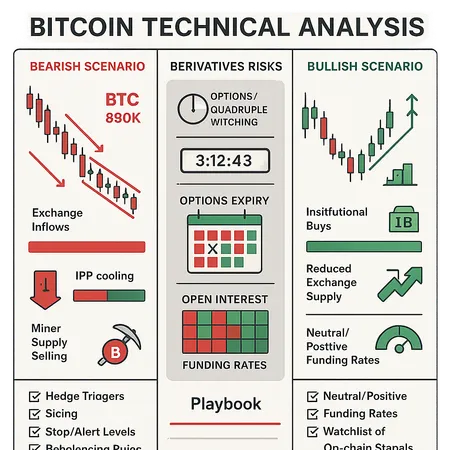
A balanced deep-dive comparing the bearish path toward $80K with the bullish compression/breakout thesis. Synthesizes technical structure, on‑chain flow, and derivatives positioning into a practical checklist for traders and portfolio managers.

A Franklin Templeton Solana ETF could materially change liquidity and derivatives pricing for SOL, but recent exchange exploits have created near-term selling pressure. This piece lays out the technicals, on‑chain signals, and concrete trade setups for swing traders and institutions managing the ETF catalyst and exchange risk.
DeFi
All DeFi postsBitcoin
All Bitcoin postsSecurity
All Security posts- Solana Risk Assessment After the Drift $285M Exploit: Price Damage, Supports, and Actionable Trading & Validator Controls
- Preparing for the Quantum Era: Post-Quantum Security for Stablecoin Rails — Arc & Naoris Case Studies
- Inside the April 1 Drift Protocol Hack: Reconstruction, North Korea Links, and a DeFi Security Playbook