Has Bitcoin Broken Down? 365‑Day MA, ETF Outflows and the Case for a New Bear Market
Summary
Quick take: what just happened and why it matters
Bitcoin recently slipped beneath its 365‑day moving average, a long‑term trend line many allocators watch as a gauge of regime change. For many market participants that single breach — combined with mounting ETF outflows — is reason to ask whether a sustained bear market has begun. The signal is serious, but not binary; it changes the odds, not the certainties.
For context, reporting shows BTC fell to about $94k and dipped under the 365‑day MA, a key technical trigger for traders and models that track annual trend momentum. At the same time, major ETF products have shown sizable redemptions, adding a liquidity angle that amplifies downside risk.
The technical picture: 365‑day MA and the $93k–$97k survival zone
The 365‑day moving average is a long‑horizon filter. Unlike the 50‑ or 200‑day averages, it smooths out a full year of price action and is therefore used by allocators who want to avoid whipsaw. When price trades above it, the narrative favors structural bulls; when it cracks and stays below, risk managers begin to prepare for longer, shallower markets.
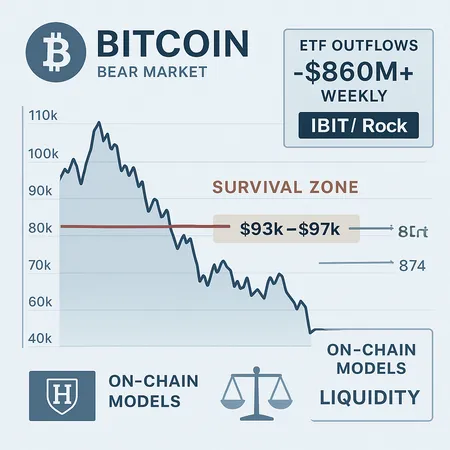
Technically, the $93k–$97k band has emerged as a short‑to‑medium‑term survival zone. A sustained close below this band would: (1) signal momentum has flipped, (2) likely trigger more systematic sell algorithms, and (3) weaken investor psychology. But a single mid‑week close under a moving average can also be a false signal if liquidity and flows reverse quickly.
Key practical takeaway: treat the 365‑day MA breach as a higher‑probability warning, not an automatic declaration of a bear market. Watch for follow‑through — consecutive closes below that zone combined with worsening ETF net flows would materially raise the probability of a multi‑month downtrend.
On‑chain downside models: $87k and $74k as possible floors
Independent on‑chain valuation and risk models are already flagging targeted downside zones. One model highlighted by market coverage points to $87k and a deeper $74k level as plausible bear‑market floors if selling pressure intensifies and liquidity thins out CryptoPotato reports these thresholds.
Why models matter: they aggregate realized price distributions, long‑term holder behavior, and historical drawdowns into probabilistic targets. If ETF sellers or leveraged liquidations force price declines toward concentrated realized‑price clusters, those $87k/$74k bands become natural magnet points where selling pressure can exhaust.
But remember models are conditional. They assume certain liquidity and flow dynamics; if institutions step in or retail demand accelerates, the path back up can be quicker than models expect. Models give scenarios — not certainties — and should be used alongside flow and liquidity monitoring.
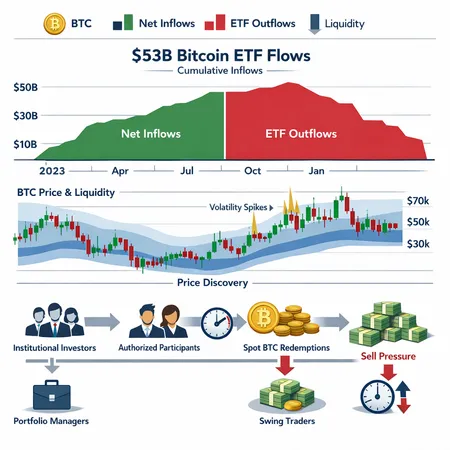
ETF flows and liquidity: IBIT, the $463M outflow, and the $860M weekly shock
ETF mechanics matter more than ever. Spot BTC ETFs provide institutional access while creating a new, on‑ramp liquidity loop: inflows can buy on spot, and outflows can create selling pressure either directly (redemptions) or indirectly via market makers.
Two recent flow episodes highlight the danger. First, BlackRock’s IBIT registered a record one‑day outflow (roughly $463M), a reminder that even flagship issuers can see rapid reversals in demand CryptoBriefing covered the IBIT outflow. Second, a separate reporting cycle covered an ETF meltdown with over $860M in weekly outflows, an event that stunned markets and materially compressed liquidity available at the top of the book Bitcoinist documented the $860M+ outflows.
Why this amplifies downside risk: large ETF redemptions can force principal providers and market makers to source BTC in stressed conditions, widening spreads and pushing price down further. If outflows are concentrated and sustained, they can turn what looks like a technical correction into a liquidity‑driven leg lower.
A practical metric to watch daily: net ETF flows (by product), exchange spot reserves, and market‑maker inventory disclosures where available. These figures tell you whether a price move is being absorbed or simply amplified by redemptions.
Institutional buys as a counterweight: not a free pass to complacency
There are visible counterpoints. Various institutional allocations and continued interest from family offices and some endowments have been reported, and these buyers provide longer duration demand. Such activity is one reason some strategists argue that dips are buying opportunities rather than the start of a prolonged bear market.
Reports of large institutional purchases — and the availability of spot ETFs that lower friction for allocators — matter. However, institutional bids are not infinite and tend to be slow, meaning they may not stop short, fast liquidations caused by ETF redemptions or leveraged selling. In other words, institutions can stabilize markets over weeks or months, but they don’t necessarily absorb flash liquidations in thin order books.
An important nuance: institutional buying often arrives at different price levels and timeframes than retail or systematic selling. That mismatch in timing and execution appetite is precisely why liquidity stress can appear even while long‑term demand exists.
Putting the pieces together: is a sustained bear market likely?
Short answer: elevated risk, but not inevitable. Consider three scenarios:
Base (higher probability given current data): a multi‑week corrective phase that pushes BTC toward the $87k band as ETF flows normalize and on‑chain models repriced realized levels. Volatility spikes; liquidity is shallow; many short‑term leveraged holders capitulate.
Bear (lower but non‑negligible): continued ETF outflows and a failure of institutional buying to provide sustained bids leads to a spiral toward the $74k zone. This is the scenario implied by downside models if liquidity continues to deteriorate and macro conditions tighten.
False breakdown (plausible): ETF flows stabilize, a short squeeze or renewed institutional allocation drives price back above the 365‑day MA, and the breach is remembered as a brief regime test rather than a full bear market.
Which is likelier depends on the persistence of ETF outflows, macro liquidity (rates, USD liquidity), and whether buy‑side reallocations accelerate. Monitoring these variables gives portfolio managers a forward edge.
Risk management and positioning: practical steps for intermediate investors and portfolio managers
This section focuses on action — not just narrative. Below are pragmatic steps to manage a multi‑scenario environment.
Sizing and diversification
- Reevaluate position sizes relative to total portfolio risk budgets. If your crypto allocation was sized for a bull regime, scale back to reflect higher tail risk. Use risk parity principles rather than simple percent-of‑portfolio heuristics.
- Avoid concentration: consider trimming correlated crypto exposures (e.g., large memecoin or altcoin bets) to retain dry powder.
Liquidity and execution
- Focus on execution: if you need to sell, prefer staged, limit‑order execution to avoid crossing wide spreads in stressed markets.
- Keep a liquidity buffer in cash or stablecoins to take advantage of better entry points rather than being forced sellers.
Hedging and downside protection
- Consider using options or futures to hedge tail risk. Put spreads can limit downside while keeping upside optionality.
- Use dynamic hedges if you have trading desks or access to OTC desks — they can structure bespoke protection that works around ETF flow patterns.
Process and operational controls
- Tighten rebalance triggers: make rebalancing conditional on both price and flow indicators (e.g., sustained ETF outflows for X days).
- Stress‑test portfolios for the $87k and $74k scenarios, and plan execution — when to hedge, when to DCA into weakness, and how much liquidity to reserve.
Watchlist — indicators to monitor daily
- Net ETF flows (product‑level), especially IBIT/BlackRock numbers.
- Exchange spot reserves and top‑of‑book depth (shortages here precede volatile moves).
- Funding rates and open interest on perpetual futures (signs of leverage build-up).
- On‑chain model signals highlighted above, plus realized price concentration bands around $87k and $74k.
A final framework: probabilities, not proclamations
The break under the 365‑day moving average and the spike in ETF outflows increase the probability of a corrective or even extended downtrend, but they do not guarantee a multi‑year bear market. The market is a function of order‑book liquidity, flow persistence, and macro liquidity conditions — all of which can evolve quickly.
For intermediate investors and portfolio managers the right posture is humble and active: treat the signal seriously, size positions to withstand a deeper drawdown, hedge where needed, and keep monitoring ETF flows and on‑chain model readouts. Platforms that surface flow data and execution liquidity (and protocols like Bitlet.app for yield or installment exposure) can help managers implement more nuanced responses without panic.
If you want a concise checklist to implement this week, focus on (1) checking your ETF exposure and counterparties, (2) running quick stress tests for $87k and $74k, and (3) setting execution plans for staged sells or buys tied to flow normalization. That way you are prepared whether this is a temporary regime test or the opening chapter of a longer cycle.