The Solana Paradox: ETF Inflows vs. SOL Price Weakness and the URPD Supply Air‑Gap
Summary
Executive overview
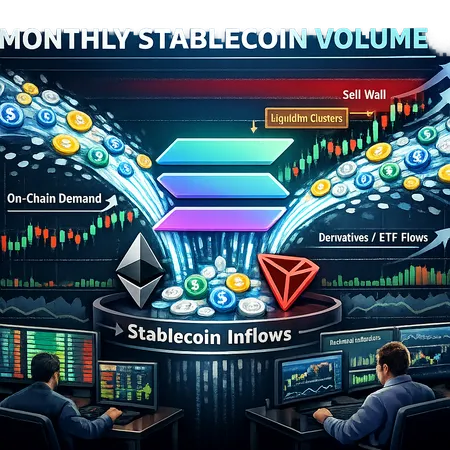
Institutional appetite for a Solana spot ETF has translated into consistent inflows—multiple consecutive days of positive net cash into ETF vehicles—yet SOL has simultaneously shown price weakness versus earlier highs. That divergence is not a paradox once you unpack how ETF flows interact with market microstructure, derivative markets, and on‑chain supply concentration.
This article reviews the evidence for ETF‑driven capital inflows, explains why price can still fall despite net purchases, dives into the on‑chain URPD supply air gap that creates outsized technical risk below ~$144, and ends with pragmatic risk‑management steps for traders and allocators who must reconcile flow data with structural exposure.
Evidence: ETF‑driven capital inflows and the flow/price divergence
Institutional interest is tangible. Reports have documented double‑digit consecutive days of net inflows into Solana‑focused spot ETF vehicles, a persistent pattern that signals steady demand from large allocators and quant funds. For a recent commentary on the duration and scale of those inflows, see this coverage documenting 11–13 consecutive days of Solana ETF inflows and the implication of institutional demand.Solana ETF inflows persist
Yet price action has not mirrored a simple demand surge. Cointelegraph reported that SOL dipped to a five‑month low even as ETF inflows continued, underlining a clear flow vs. price divergence that deserves closer inspection rather than reflexive bullish or bearish narratives.SOL hits 5‑month low despite ETF interest
Why price can weaken even as ETFs buy
Several non‑mutually exclusive mechanics explain how net inflows can coexist with price weakness.
ETF mechanics, creation/redemption timing, and market impact
Most spot ETFs operate in cash, with market makers or authorized participants (APs) handling creation/redemption. That process can produce timing mismatches between when dollars arrive and when liquidity is sourced in the underlying spot market. Additionally, if APs hedge with derivatives rather than executing large spot buys instantly, the visible ETF inflow won't immediately absorb sell pressure in spot order books.
Liquidity depth and on‑chain liquidity mismatch
Spot ETF inflows can be large relative to the available liquidity at given price levels. On exchanges and on‑chain pools, significant buy demand concentrated over several hours or days can still leave shallow book depth near current prices. When market participants attempt to exit—especially large, algorithmic sellers or funds—the market can gap if there aren’t enough bids in critical price bands (more on the URPD supply air gap below).
Derivatives and alpha extraction
Derivative markets (futures, perpetuals, options) often amplify moves. Traders can short futures or use options to express bearish views even as ETFs buy spot; large short positions can pressure funding rates and discourage spot aggressiveness. Hedge desks may delta‑hedge ETF creations with short futures, which temporarily depresses spot liquidity.
On‑chain concentration and holder behavior
A nontrivial portion of SOL supply sits with whales, early investors, and staking contracts. Concentration can create fragility: if a few large holders decide to realize profits or rebalance, their sales can overwhelm visible buy demand. On‑chain metrics often reveal clusters of supply at particular purchase‑price bands—this is where URPD comes in.
Retail rails, USDC velocity and broader market context
Longer‑term retail demand (or lack thereof) also matters. Integrations like Cash App announcing USDC transfers on Solana in 2026 represent potential future retail rails that could increase velocity and on‑chain activity, but they are multi‑year structural developments rather than immediate bid drivers. Some coverage highlights both the potential boost and the skeptical view—analysts in that piece warned of extreme downside scenarios as a counterpoint.Cash App USDC transfers and implications
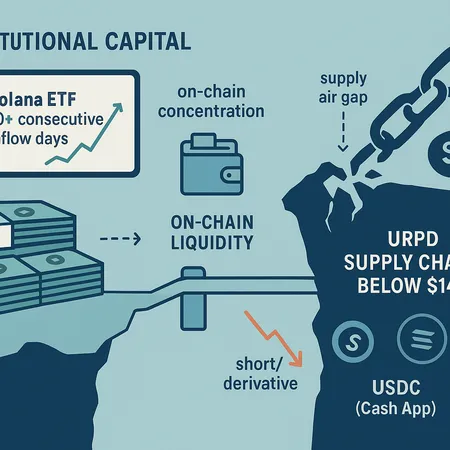
The URPD supply air gap: what it is and why it matters
URPD (on‑chain distribution of holders by purchase price bands) shows where SOL holders are concentrated and whether there's available supply or latent resistance below current levels. Recent on‑chain analysis pointed to a meaningful supply 'air gap' below approximately $144—meaning relatively few addresses accumulated between certain price bands, and therefore limited natural buy support if price re‑tests that zone.URPD shows a supply chasm under $144
Why that matters:
- If price drops toward that zone, there may be fewer buyers to absorb selling, increasing the chance of a sharp move lower.
- Large passive holdings (staked SOL, exchange cold wallets) are not equivalent to active bids; their presence doesn’t prevent price breaks when market makers withdraw liquidity.
- The URPD air gap can act as a technical accelerator: once the price crosses through thin bands, stop orders and liquidation cascades can trigger outsized moves.
The Cointelegraph piece showing SOL at a five‑month low while ETF flows persisted is an example of how flow alone doesn’t neutralize these structural vulnerabilities—particularly if ETF buys are being hedged or timed in ways that don’t shore up on‑chain liquidity.Sol price versus flows explained
Putting the pieces together: a plausible market narrative
- Institutional allocators deploy capital into Solana spot ETFs—steady inflows are visible and persistent.
- Authorized participants and market makers assimilate those inflows via a mix of spot buying, derivative hedging, and inventory management.
- Meanwhile, spot order books and on‑chain URPD concentration show a thin band of active liquidity under current prices—an air gap.
- If a liquidity shock occurs (macro risk event, derivatives unwind, or a large on‑chain sale), the thin bands can cause price to fall sharply despite cumulative inflows into ETFs.
This is why ETF flows are a necessary but not sufficient bullish signal: they matter for long‑term allocation and network effects, but microstructure and on‑chain supply concentration can dominate short‑term price realization.
Practical risk management for traders and allocators
Whether you are an active trader or an allocator sizing a strategic position, reconcile flow signals with on‑chain structural risk using the following checklist.
For active traders
- Monitor URPD and supply bands: integrate an alert for sizable supply gaps around your key stop levels.
- Use hedges: employ options collars or short futures to protect downside during periods of asymmetric on‑chain risk.
- Reduce reliance on naive stop‑losses: in ultra‑thin bands, stop orders can cascade; consider limit exits or adaptive stop bands that account for order‑book depth.
- Size relative to liquidity: limit trade sizes as a multiple of average depth at your entry price (e.g., <5–10% of visible bids at the time).
For allocators and funds
- Layer entries: use dollar‑cost averaging or installment purchases across ETF inflow windows (a tactic relevant to platforms such as Bitlet.app) to avoid full exposure into transient liquidity conditions.
- Stress test scenarios: model price outcomes that include rapid vaporization of bid depth through the URPD air gap; measure P&L under 1x, 2x, 5x the typical slippage assumptions.
- Counterparty and custody checks: confirm where large inflows are being executed and whether APs are hedging with derivatives—this affects short‑term spot absorption.
- Liquidity contingency plans: define thresholds where you will pause buys if on‑chain supply concentration or funding rate signals cross predefined levels.
Ongoing monitoring datapoints
- URPD and distribution heatmaps around $144 and other psychological bands.
- Exchange order‑book depth and DEX liquidity pool size at relevant price bands.
- Funding rates, open interest on SOL futures, and option skew—to spot synthetically expressed bearish risk.
- ETF inflow cadence: day‑to‑day changes matter, but so does the typical AP response (spot buy vs. derivative hedge).
Tactical checklist: what to watch this week
- ETF net flows and whether APs shift from hedging in derivatives to executing spot purchases. See the inflow streak analysis for context.ETF inflow streak
- URPD concentration under $144 and nearby liquidity bands; a break below could accelerate downside as noted in on‑chain analyses.URPD air gap analysis
- Short interest and derivatives positioning: rising shorts with high open interest can magnify selling pressure.
- Retail rails and demand velocity signals, including long‑horizon developments like Cash App’s USDC transfer plans that may increase future on‑chain activity but won’t plug current air gaps overnight.Cash App USDC on Solana note
Final thoughts — balancing flows and structural risk
The Solana story right now is neither purely bullish nor purely bearish. ETF inflows are a meaningful sign of institutional allocation and can support higher long‑term valuation, but they do not automatically immunize the token from short‑term microstructure failures driven by thin on‑chain liquidity and concentrated supply. Traders and allocators who reconcile both dimensions—watching ETF cadence while respecting URPD supply bands and derivatives activity—will be better positioned to manage asymmetric downside risk.
For active practitioners, that means bespoke hedges, conservative sizing, and explicit contingency rules. For allocators, it means pacing exposure and stress testing for liquidity shocks. And for anyone tracking the narrative, remember that long‑term rails (e.g., Cash App’s planned USDC transfers) are important but incremental: they change the probability of constructive demand over months and years, not necessarily the immediate liquidity profile.
If you want tools to implement staggered entries or installment buys while monitoring on‑chain signals, consider platforms that let you combine execution discipline with flow awareness. For many traders and allocators, pairing ETF flow tracking with URPD monitoring will remain the best way to reconcile the paradox in practice.
Further reading
- ETF inflows coverage and context: Solana ETF inflows record streak
- On‑chain URPD and supply air gap discussion: NewsBTC analysis of Solana’s air gap
- Flow vs. price divergence reporting: Cointelegraph on SOL lows amid ETF interest
- Retail rails & broader demand context: Cash App USDC transfer plans and implications
For context across ecosystems, many traders still watch Solana flows alongside broader activity in DeFi to triangulate demand and velocity signals.