The Solana Paradox: Why SOL Keeps Falling Despite ETF Inflows
Summary
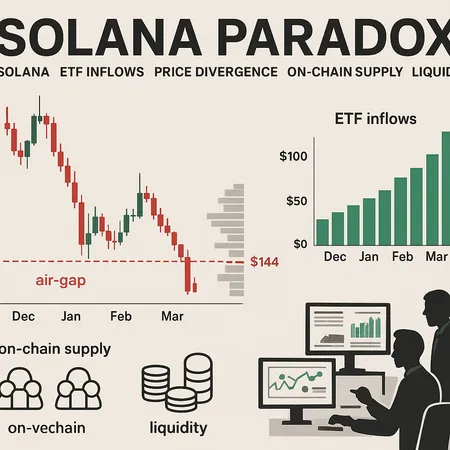
The Solana paradox: inflows on paper, weakness in spot
Solana ETFs have been logging persistent inflows while SOL’s spot price grinds toward multi‑month lows — a textbook price divergence that has traders rubbing their eyes. On one hand, outlets reported roughly $370 million tied to ETF activity even as prices slid, highlighting a disconnect between headline institutional demand and immediate spot strength (CoinTribune report). On the other, data shows Solana ETFs recorded 11 consecutive days of inflows, suggesting steady institutional accumulation at the product level (The Currency Analytics).
For active traders and on‑chain analysts the core question is simple: why isn’t the accumulation reflected in a higher spot price? The answer lies beyond headline inflow figures and into timing, execution, and structural liquidity across exchanges and on‑chain markets. Bitlet.app users, for example, who monitor flows and order books know that a labeled ‘inflow’ does not always translate to immediate buys on spot order books.
What ETF inflow numbers actually mean in practice
ETF inflows mean managers receive cash from investors and then deploy that capital according to the product’s mandate. The path from cash in to SOL on an order book varies. Some ETFs purchase spot SOL, some use derivatives, and others accumulate exposure synthetically before hedging elsewhere. That creates timing mismatches.
The sequence also matters: inflows aggregated across many funds may be executed over hours or days, sliced to minimize market impact. If managers are buying into thin liquidity windows, their bids can be absorbed without moving the last traded price much — or worse, concentrated selling on exchanges or algorithmic sellers can swamp a single day of ETF buying.
This is why the record of 11 consecutive inflows is important but not definitive. It shows steady demand, yes — but not necessarily the speed or the venue of execution. Traders should map ETF NAV changes against actual spot exchange buy prints to see the conversion rate from inflows to executed buys.
On‑chain supply dynamics and the ‘air gap’ under $144
On‑chain analysis reveals deeper structural constraints. Recent reporting highlights an “air gap” of supply beneath roughly $144 — meaning there are few significant resting buy orders or deep liquidity pools until that level is approached (NewsBTC analysis). In practice that manifests as thin depth on centralized order books and sparse DEX liquidity at price levels below current trading.
Why does the air gap matter? Because when market sell pressure arrives — whether from miners, liquidations, large holders reallocating, or systematic sellers — the price can gap down quickly into that low‑liquidity zone. Even routine ETF accumulation, if executed passively, can fail to absorb a surge of aggressive sell orders. In markets with an air gap, trade size vs resting liquidity is the decisive variable.
Concentration of supply also plays a role. Large holders (whales), staking rewards and scheduled unlocks can increase floating supply available to markets. If a meaningful portion of inflows are being met by sellers who want to realize profits or rebalance, ETF demand becomes a passing counterflow rather than a source of persistent price support.
Technical inflection points traders are watching
Technically, traders have a short list of levels and indicators that matter in the current setup:
- $170 area — recent analyses flagged this as a critical inflection where bulls need to reclaim control for a sustained rebound (CoinPedia analysis).
- $144 support / air gap boundary — beneath this there’s thin liquidity; a breach could accelerate downside.
- Volume profile nodes and order‑book depth — low traded volume at current ranges suggests weak conviction; watch for spikes in on‑exchange liquidity.
- Derivatives signals — open interest, funding rates, and basis between futures and spot show where leverage is stacked and who could be forced into selling.
Combine these with macro cues — BTC directional moves, liquidity conditions, and altcoin rotation — and you get a multi‑layered trade map. For scalpers and swing traders, tight stops around the air‑gap threshold and a bias toward liquidity capture (limit buys into visible resting orders) are prudent.
Can ETF demand sustainably prop up spot price or will structural liquidity win out?
There is no neat binary answer; outcomes depend on execution, market structure, and event risk. Consider three scenarios:
Bull case: ETF inflows continue and managers execute disciplined, phased spot buys. Concurrently, macro conditions stabilize and on‑chain selling abates. Over weeks this reduces the air gap as bids accumulate and market depth rebuilds, letting SOL recover.
Base case: ETF inflows persist but are offset by episodic selling from holders, derivatives deleveraging, or rotation into other altcoins. Price grinds sideways with occasional volatile down moves into low‑liquidity zones; ETF demand provides a valuation floor but not steady appreciation.
Bear case: A concentrated sell event (large exchange inflow, staking unstake wave, macro risk) breaches the $144 zone, triggering stop cascades into the air gap. ETF buying follows but is executed at lower prices or is too slow to stem the cascade, leaving the spot price materially lower.
Institutional demand is necessary for sustained long‑term price appreciation, but it is not sufficient when structural liquidity is weak. ETF flows can be neutralized by concentrated supply or execution timing mismatches. This is the engine of the current price divergence.
Practical checklist for traders reconciling flows with spot weakness
Track these live to form a view that reconciles ETF inflows with on‑chain reality:
- ETF inflow headlines vs actual NAV and timing of purchases.
- Exchange inflows/outflows and large wallet movements on Solana mainnet.
- Order‑book depth at key price bands around $170 and $144.
- Derivatives open interest, funding, and basis to spot.
- DEX liquidity and concentrated pool sizes that could be drained.
Monitoring these will help you answer whether ETF demand is actually bolstering spot or merely papering over a fragile liquidity profile.
Bottom line
The Solana paradox is not mystical — it’s structural. ETF inflows indicate demand but do not automatically heal an on‑chain and exchange liquidity shortfall. Until buy pressure consistently rebuilds resting liquidity below current levels, the market remains vulnerable to sudden drops through the air gap. For active traders and on‑chain analysts, the reconciliation lies in measuring the conversion of inflows into executed spot buys, watching large holder behavior, and respecting technical inflection points such as $170 and the fragile support around $144. Keep an eye on ETF flow reports, but let order‑book mechanics and on‑chain signals drive position sizing and risk management — and, as always, cross‑check flows using tools like Bitlet.app when available.
For broader context on market behavior, compare SOL’s divergence to other altcoin cycles and watch how capital rotates between Bitcoin and DeFi narratives as the macro picture evolves.