Bitcoin: $80K Risk vs. Compression Breakout — An Evidence-Based Playbook
Summary
Executive summary — two competing narratives
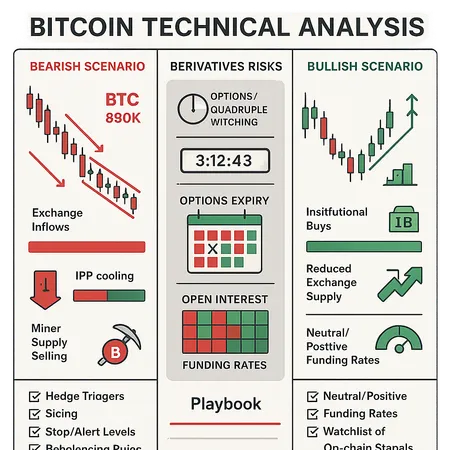
Bitcoin’s short‑to‑medium term story is binary: one camp sees a bearish continuation that could test the $80K area if bulls fail to clear key resistance; another argues current compression is simply the prelude to a high‑timeframe breakout. This article weighs both scenarios using technical patterning, on‑chain flow signals (including Inter‑exchange Flow Pulse), and derivatives positioning — and then gives an actionable checklist for traders and portfolio managers.
For many traders, Bitcoin remains the primary market bellwether. Below I parse the evidence and translate it into clear monitoring triggers and trade/portfolio rules you can apply whether you want to trade the range or protect long exposure.
1) Price structure: where technicals point
The bearish case: a bear flag / bearish channel
Technically, several analysts have flagged a persistent bearish structure: lower highs, a tightening bear flag, and a channel that tilts downside unless a decisive breakout occurs. That view emphasizes that failed attempts to reclaim nearby resistance often precede steep retracements; some technical reads even outline a pathway toward ~$80K if bulls can’t clear the immediate barrier and momentum rolls over. See a cautionary technical walkthrough here for the bearish thesis and risk scenario.
The bullish counterpoint: compression and breakout potential
The alternative thesis treats the same price compression as equilibrium buildup — declining ranges that typically precede large directional moves. Proponents point to high‑timeframe compression patterns and macro tailwinds as conditions for a breakout, arguing that tight volatility now increases the odds of a meaningful extension higher rather than a fast unwind lower. A detailed bullish decomposition arguing for this high‑timeframe breakout is useful context when sizing risk and defining time horizons.
2) On‑chain flow: supply, IFP, and exchange inflows
On‑chain indicators ground the technical story by showing how supply and speculative demand have behaved.
Inter‑exchange Flow Pulse (IFP): the IFP metric — which tracks net flows and speculative cross‑exchange movements — has shown a clear cooling of speculative activity recently. Lower IFP suggests fading short‑term leverage and speculative pressure, a datapoint that supports both narratives depending on interpretation: less speculative froth reduces blow‑off top risk, but it also removes a typical buyer base during compressions. See the IFP analysis here.
Large transfers to exchanges: there have been notable large BTC transfers to major venues (notably Binance), which can test investor cost bases and increase the probability of sell pressure if liquidity needs arise. On‑chain reporting of transfers above 3,000 BTC into exchanges is an important flag for potential exchange‑flow pressure and should be watched as a raw supply input into the market.
Miner supply vs. institutional buys: the balance between miner outflows and steady institutional accumulation remains a critical supply/demand battleground. If miners increase selling into a thin tape while institutions pause, downside momentum can accelerate even if technicals look neutral.
Taken together, the on‑chain picture is mixed: IFP cooling and institutional bids temper a burst to the upside, while exchange inflows and miner selling provide a credible catalyst for a downside impulse.
3) Derivatives positioning & market structure risks
Derivatives amplify both directions — and calendar events can concentrate that amplification.
Options expiries and quad witching: approaching options and stock/derivatives expiries can create asymmetrical risks as positions get delta‑hedged, rolled, or closed. Short‑term volatility spikes around expiry dates are well documented; traders should anticipate squeezes or cascade moves when large expiries fail to find liquidity. The upcoming expiries were recently flagged as a potential near‑term volatility driver.
Funding rates and perpetual swaps: funding rates remain a live dashboard for crowd positioning. Persistently positive funding signals long dominance (and potential short squeeze risk), while negative funding implies short dominance (and potential capitulation if funding reverts). Watch sudden funding spikes — they often precede violent mean restorations.
Open interest & concentrated strikes: look at the strikes with concentrated option open interest. If a large chunk of delta sits at a single strike near current price, gamma/break‑even dynamics can push the market toward or away from that level as market makers hedge.
Collectively, derivatives positioning is the short fuse — it doesn’t change the structural argument by itself, but expiries and funding dynamics often decide which structural path plays out first.
4) Synthesizing evidence: what tilts the odds?
Which scenario is more likely? Neither wins by default; it’s conditional.
Bearish tilt triggers: a decisive failure to reclaim key resistance, renewed large transfers to exchanges, rising miner sales, and derivatives showing negative funding with concentrated put positions would materially raise the odds of a wash to the low‑$80K area (the downside scenario highlighted in some technical pieces).
Bullish tilt triggers: shrinking exchange balances, sustained institutional accumulation, low and rising IFP consistent with renewed speculative inflows, and clean absorption of options flow at higher strikes would support a breakout thesis.
Because the signals can be noisy and lag each other, treat them as a weighted checklist rather than binary inputs.
5) Practical playbook — checklist for trades and portfolios
Below is an evidence‑based, prioritized checklist for intermediate traders and portfolio managers. Use it to structure watchlists, entries, exits, and hedges.
Monitoring and early‑warning items (live signals)
- Track IFP: rising IFP = spec demand returning; falling IFP = speculative cooling. If IFP is trending up and exchange balances fall, bias toward breakout plans.
- Watch exchange inflows (especially large transfers, e.g., 3,000+ BTC moves): sustained heavy inflows = increased downside risk. A single large inflow isn’t decisive, but persistent inflows over 24–72 hours are a red flag.
- Funding rate regime: note the funding sign and spikes. Rapid reversals in funding often precede short squeezes or deleveraging cascades.
- Options calendar: mark options/quad‑witching expiries on your calendar and monitor open interest concentrations. Expect elevated volatility in windows surrounding expiries.
- Miner outflow vs. institutional balance: if miners accelerate selling while institutional buys slow, reduce gross exposure.
Trade rules (tactical traders)
- If price fails at the defined resistance band and exchange inflows rise: consider lightening long exposure, tighten stops, or buy protective puts. Define stop levels using the technical bear flag invalidation point.
- For breakout bias: wait for a confirmed breakout candle with above‑average volume and declining exchange balances. Prefer entries on a retest or strength above the breakout with a clear funding reset.
- Use options defensively: buy puts as portfolio insurance or sell covered calls to monetize volatility if you’re long. Prefer staggered put strikes for time‑decay efficiency.
- Avoid aggressive leverage around major expiries unless you have a clear vega/gamma play; derivatives windows are less predictable.
Portfolio rules (multi‑week to multi‑quarter managers)
- Size risk by conditional buckets: full conviction allocation only after both on‑chain and technical breakout confirmation. Partial exposure when the thesis is mixed but macro supports upside.
- Hedging ladder: allocate a small hedge (1–10% of portfolio) via puts or inverse products; scale hedges up if the bearish checklist lights up.
- Rebalancing thresholds: predefine rebalancing bands (e.g., reduce BTC exposure if it drops X% from peak or if exchange inflows exceed Y BTC/day for Z days). Predefined thresholds remove emotion from decisions.
- Liquidity buffer: keep cash/stablecoin dry powder to buy on weakness — avoid being margin‑forced sellers during derivative‑driven moves. Bitlet.app can be part of a toolkit for managing installment or laddered exposure while preserving liquidity profiles.
6) Example conditional scenarios (actionable)
Scenario A — Bearish cascade: BTC fails at resistance, exchange inflows jump, funding turns negative, and a major expiry lacks buyer demand. Action: reduce leverage, hedge 10–25% of net BTC exposure with puts or inverse exposure, raise cash to target reentry levels.
Scenario B — Clean breakout: BTC breaks above resistance with volume, exchange balances decline, IFP ticks higher, and options flow is absorbed. Action: add to position on retest, scale into momentum with trailing stops, and consider selling short‑dated calls to monetize elevated implied volatility.
7) Signals to ignore or de‑emphasize
- Single‑data‑point narratives: one large whale transfer without follow‑through is noise. Evaluate persistence and corroboration across metrics.
- Headlines without on‑chain confirmation: media narratives can move sentiment fast; always check flows and derivatives for validation.
Closing thoughts — probability management, not crystal balls
This is not a prediction but a framework. The market can hand either path to participants. The correct approach for intermediate traders and portfolio managers is to: 1) convert qualitative narratives into measurable signals (IFP, exchange inflows, funding, expiries), 2) set pre‑agreed thresholds for action, and 3) execute small, disciplined trades or hedges rather than large, reactive bets.
Combining Bitcoin technical analysis with on‑chain flow and derivatives monitoring gives you a repeatable playbook — whether you’re managing a trading book or an institutional allocation. Keep your watchlist tight, place calendar reminders for expiries, and treat exchange inflows and IFP as first‑order risk signals.
Sources
- Bearish structure warning: Bitcoin price analysis
- BTC risks dump to $80K if bulls fail to clear barrier
- 3,000+ BTC transferred to Binance, testing cost basis
- IFP: speculative activity cooling on chain
- Options and stock expiries can affect short‑term volatility
- Bullish compression and high‑timeframe breakout thesis