How Options Flow and Monthly Expiries Amplified January’s Crypto Sell‑Off
Summary
Executive summary
The late‑January sell‑off looked, at first glance, like a simple spot unwind. The deeper story was one of options flow and expiry mechanics turning directional hedges into spot pressure. Deribit’s early monthly expiry positioning showed a notable tilt toward protective bearish hedging, and concentrated open interest clustered around key strikes created the conditions for squeezes and cascading liquidations when BTC dipped. For options traders and risk managers, the task is to read these signals early, quantify gamma and open interest risk, and choose hedges that preserve optionality without bleeding P&L when volatility spikes.
What the market structure looked like going into January
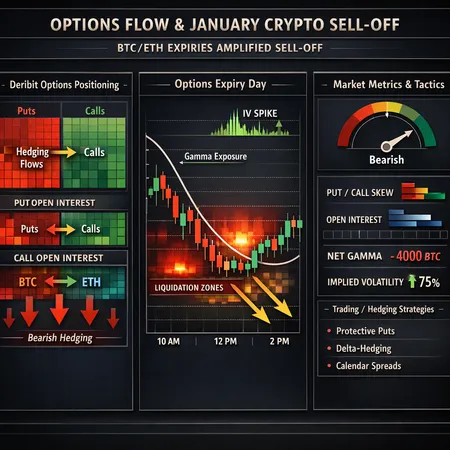
Institutional and retail activity has moved a lot of risk into listed options markets — especially on Deribit. That creates a visible map of where market makers and leveraged funds have their exposures: strikes with outsized open interest, skewed put/call ratios, and concentrated gamma. According to reporting on Deribit’s first monthly expiry of 2026, flow ahead of that settlement showed traders buying downside protection, a classic sign of bearish hedging that can magnify downside when delta hedges are executed into the market Deribit options positioning signaled bearish hedging.
The practical implication: when many market participants buy puts or sell calls, the dealers who are short those options rotate risk into the underlying — selling spot or futures to remain delta‑neutral. That selling can accelerate a move down in a thin window, especially near a monthly expiry where a large portion of open interest stands to be assigned or expires worthless.
How monthly expiries amplify spot moves: the mechanics
Monthly expiries concentrate risk. When a large chunk of BTC/ETH open interest centers on a handful of strikes, several interacting forces create tail risk:
Gamma pinning and dealer hedging: Dealers who sold options will hedge their negative gamma by trading the underlying. As spot falls toward strike levels with heavy short‑gamma, dealers sell more to stay hedged, pushing spot further down and increasing hedging intensity. This is the classic positive feedback loop.
Forced liquidations and margin spirals: Sharp spot moves trigger liquidations for leveraged long positions. Those liquidations create additional market sells, which can trip more margin calls and further accelerate the drop. The BTC slide that hit ~$82k in January set off about $1.7 billion in liquidations — a real‑time example of how rapid deleveraging can cascade (NewsBTC, CoinPaper).
Expiry pin risk: Ahead of expiry, option writers prefer spot to finish near strikes where they have sold premium (pinning). If large OI sits at a strike, order flow converges to that price as the market approaches expiry, sometimes creating concentrated squeezes if that price level no longer reflects spot sentiment.
Volatility and vanna/vega effects: Large option flows alter implied volatility, and sharp changes in IV force dealers to adjust vega exposures. Those adjustments can manifest as additional hedging flows in spot or futures, increasing realized volatility.
A practical illustration: multiple reports ahead of the monthly BTC/ETH expiry highlighted heightened volatility risk and the possibility of squeeze dynamics as traders adjusted positions into settlement (CoinGape preview of expiry).
Reading the tape: metrics that matter (and how to interpret them)
When you’re translating positioning into actionable tactics, quantify the signals. Here are the key metrics and how to use them.
Put/Call skew (and directional bias)
- What it measures: Relative demand for puts vs calls across strikes and expiries. A pronounced put skew means more demand for downside protection.
- How to read it: Rising put skew ahead of expiry often signals hedging or a fear of downside. If skew steepens while spot is flat, expect dealer hedging to add downward pressure if the market moves.
- Actionable threshold: A rapid skew move of several percent in a short window (24–72 hours), combined with concentrated put OI, should raise red flags for downside squeezes.
Open interest (OI) by strike and expiry
- What it measures: The outstanding contracts at a strike — the most direct map of where exposures lie.
- How to read it: Large OI clustered at a few strikes near spot means any move toward those strikes will force heavy hedging. Pay attention to the ratio of OI to average daily volume — low liquidity + large OI = higher squeeze risk.
- Practical tip: Track OI heatmaps for weekly and monthly expiries; a single strike with >10–20% of total OI for that expiry should be considered a potential pin/squeeze point.
Gamma exposure (dealer positioning)
- What it measures: Aggregate gamma tells you how much dealers will buy/sell spot as the price moves. Net short gamma means dealers will buy into rallies and sell into dips — amplifying moves.
- How to read it: Short net gamma with concentrated OI around near‑term expiries is a recipe for amplified volatility; dealers’ delta hedging can cascade markets.
- Data note: Exchanges sometimes publish estimated gamma stacks; combine them with OI to estimate how much underlying notional could be traded per 1% move.
Implied Volatility (IV) vs realized volatility
- What it measures: IV is the market’s expected volatility; realized is what actually happens.
- How to read it: Rising IV into expiry usually reflects mounting demand for protection. If IV jumps but no liquidity appears in spot, the market is delicate: any spot shock will meet thin liquidity.
Funding rates and perpetual futures basis
- What it measures: Funding indicates directional leverage in perpetuals. Sharp positive funding = long speculative leverage; negative = shorts are paying longs.
- How to read it: High positive funding into an expiry increases long liquidation risk if spot turns. Monitor funding in tandem with OI to estimate liquidation vulnerability.
Liquidation risk metrics
- What it measures: Estimated marginal liquidation levels derived from on‑chain and exchange data.
- How to read it: Large clusters of leverage just below key strikes means a breach will cascade. Reports from January showed the interaction between expiry mechanics and leverage that culminated in a major liquidation wave (NewsBTC coverage).
Trading and hedging strategies around expiries: playbook for traders and risk managers
Below are pragmatic tactics mapped to common positioning scenarios. Each assumes you’ve already monitored the metrics above.
If you see rising put skew and concentrated downside OI
- Short‑term protective approach: Buy protective puts or put spreads (bear put spreads) rather than outright long puts to control premium cost. A vertical spread limits cost while preserving downside protection.
- Collar strategy: If you hold spot, sell covered calls and buy puts (collar) to cap upside but protect downside — useful for reducing hedging cost during high IV.
- Roll or stagger expiries: Instead of concentrating protection at a single expiry, stagger protection across weekly expiries to avoid being trapped by a single monthly settlement.
If dealers are net short gamma and OI is concentrated near spot
- Reduce directional leverage: Close or trim levered positions ahead of expiry. The cost of doing so may be cheaper than being liquidated into thin markets.
- Gamma scalping: If you are structurally long gamma (own options), actively delta‑hedge (buy/sell spot) to monetize the volatility as markets swing. This requires execution and trading bandwidth.
If IV is high but you expect mean reversion
- Sell premium selectively: Consider selling call credit spreads or put credit spreads if you believe the move is overdone — but cap tail risk with wings to avoid ruin from a further break.
- Calendar/Diagonal spreads: Buy longer‑dated options and sell near‑dated options into high IV to harvest time decay while retaining longer‑term exposure.
If liquidation clusters are evident below a strike
- Use limit hedges and liquidity ladders: Execute hedges in slices rather than market sweeping orders. If you must hedge immediately, prefer TWAP/VWAP executions or work with OTC liquidity providers.
- Protective puts sized to expected liquidation notional: Size downside protection to approximate the notional that would be forced to sell on a breach.
Execution considerations
- Be mindful of slippage and changing IV: Buying protection as IV spikes becomes more expensive; sometimes it’s optimal to hedge via correlated instruments (e.g., futures) and put on options later.
- Work with OTC desks for large hedges: For sizable protection needs, OTC trades can avoid moving listed markets and preserve price.
- Monitor funding across perpetuals: A funding flip can alert you to leveraged unwind risk before spot liquidations occur.
A simple expiry timing and decision checklist
Use this as a pre‑expiry routine to convert signals into actions:
- Scan OI heatmap: flag any strike with outsized share of OI for the upcoming expiry. If flagged, proceed to step 2.
- Check skew and IV: is put skew steepening and IV jumping? If yes, protective action is warranted.
- Estimate gamma exposure: are dealers net short gamma near the spot? If short, expect amplification of moves.
- Assess liquidation clusters and funding: where are the largest leveraged longs/shorts? High leveraged longs + concentrated downside OI is dangerous.
- Decide execution: reduce leverage, stagger hedges, or buy protection sized to expected forced‑sell notional. Use OTC if size is material.
- Post‑expiry review: quantify P&L of hedges and adjust the net position for the new gamma/vega landscape.
Case study: January’s BTC dip and the $1.7B liquidation wave
January offered a concrete example of the mechanics above. Coverage tied the price drop to a mix of macro commentary (Fed‑chair remarks), concentrated options flows, and a leverage unwind that produced large liquidations. Reporting linked the BTC slide to roughly $1.7 billion in liquidations and highlighted how expiry‑adjacent activity exacerbated the move (NewsBTC, CoinPaper). These stories illustrate the tight coupling between macro triggers, options positioning (protective hedging), and the fragile liquidity environment that turns a move into a cascade.
Final rules of thumb for risk managers
- Never ignore concentrated short‑gamma: when short gamma is concentrated near spot, reduce lever or add protection — quickly.
- Size protection to the market, not to your P&L: estimate worst‑case forced liquidation notional and hedge accordingly.
- Prefer optionality over blunt stops: buying downside protection preserves upside optionality versus immediate spot liquidation.
- Use multiple instruments: mix futures, listed options, and OTC to minimize execution footprint and slippage.
- Keep a post‑expiry playbook: expiries reset the gamma and vega landscape; re‑assess OI heatmaps and open new hedges only after accounting for the expiration’s net effect.
Where to monitor data and tools
Track OI and gamma heatmaps on exchange dashboards and third‑party analytics providers, and watch headlines for expiry‑related flow alerts. For traders who want integrated execution and risk tools, platforms like Bitlet.app can be part of a workflow that combines spot, derivatives, and structured hedging — but the key is instrumenting alerts for OI cluster moves, skew shifts, and funding flips.
Conclusion: position sizing, discipline, and early signals
Options positioning and monthly expiries are not esoteric — they’re mechanical levers that convert hedging into spot flow. Traders and risk managers who monitor put/call skew, strike‑level OI, gamma exposure, IV dynamics, and funding rates can anticipate where the market is fragile and choose hedges or execution strategies that avoid the worst of expiry‑driven squeezes. The January sell‑off was a reminder: when many players buy protection simultaneously, the hedges themselves become the market. Stay vigilant, size protection to potential forced flows, and prefer staggered, flexible hedges over single‑point bets.
Sources
- https://www.cryptopolitan.com/btc-options-signal-shift-to-bearish-hedging/
- https://coingape.com/crypto-traders-brace-for-bitcoin-ethereum-options-expiry-today/
- https://www.newsbtc.com/news/bitcoin/bitcoins-slide-to-82k-sets-off-a-1-7-billion-chain-reaction/
- https://coinpaper.com/14169/bitcoin-price-prediction-btc-dumps-to-82-6-k-as-fed-chair-talk-and-liquidations-hit?utm_source=snapi
For deeper drills, monitor exchange OI heatmaps and implied/realized volatility spreads, and maintain execution partnerships that can scale hedges without moving the market.