Why Ethereum Leverage Returned: Binance Spike, ETF Flows, and Liquidation Risk
Summary
Executive summary: two forces colliding
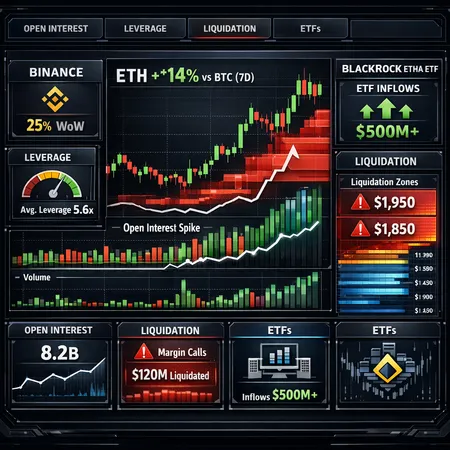
Over one week we saw a familiar but dangerous pattern: Binance data showed a roughly 25% week-on-week rise in ETH trading volume and a fast climb in futures open interest, while spot ETFs — led by BlackRock's ETHA — continued to report heavy inflows. That combination matters because it pairs structural spot demand with leveraged beta, and the latter can turn sustained flows into amplified price swings and liquidation cascades. For intermediate traders and risk managers, the question is not whether ETH demand exists (it does), but whether the concentration of leveraged positions makes the next meaningful pullback disorderly.
The evidence: Binance and market reporters documented the exchange-side leverage return and OI growth (The Currency Analytics; CoinTribune consolidation). At the same time, spot Ethereum ETF flows hit three-week highs with BlackRock's ETHA posting leading daily inflows (crypto.news) and price action showed a short-term outperformance: roughly 14% higher vs. Bitcoin over seven days in the reporting cited (BeInCrypto analysis).
Why this combination matters: ETF flows vs leveraged futures
Spot ETF inflows are actual demand for ETH tokens. They remove supply from the market and provide a price floor of sorts, especially if inflows are steady. However, ETFs are not interchangeable with leveraged futures exposure: perpetual and futures markets supply leverage and instant exposure, and they respond quickly to short-term macro or technical signals.
When ETF-driven spot demand coexists with rising futures open interest (OI), two dynamics emerge:
Funding and basis pressure. Sustained spot buying can push the basis (futures premium) tighter, but if leverage pushes longs into crowded positions, funding rates rise and the market becomes sensitive to rate swings. Rising funding invites shorts to lean on the market, which can set up fast mean-reversion.
Amplification and liquidity dry-up. ETFs can steady price gradually, but highly leveraged positions on exchanges like Binance can produce abrupt moves when margin calls trigger liquidation cascades. The result is amplified short-term volatility even if the medium-term trend remains upward.
Put simply: ETF flows can underpin a trend; leverage determines how jagged the path becomes.
On-chain and exchange open-interest signals to watch
Risk managers should synthesize several signals rather than relying on a single chart. Key metrics and why they matter:
Exchange Futures Open Interest (OI). Rising OI alongside rising price typically indicates fresh leverage entering longs. Rapid OI growth on Binance was the headline; watch OI growth rate and concentration on major venues.
Perp funding rates. Positive and spiking funding rates imply longs are paying to hold positions — a classic setup for painful long liquidations if price corrects. Negative funding suggests short dominance.
Perp basis / futures basis. A steep premium signals strong bull positioning; a quick collapse in premium often accompanies forced deleveraging.
Exchange ETH balances. Net withdrawals from exchanges (or reduced exchange balances) indicate less locational supply and can support price; sharp inflows back to exchanges may precede selling pressure.
Stablecoin flows and ETF creation/redemption notices. Daily ETF creation numbers and stablecoin mint/burn flows can clarify whether demand is enduring.
Concentration of margin on a few accounts. Public reporting sometimes shows account-level concentration; when a small cohort holds outsized exposure on margin, tail risk increases.
Combine these metrics: rising OI + positive funding + decreasing exchange balances + heavy ETF creations signals a fragile bullishness driven by both institutional spot and retail/prop leverage — a recipe for sharp, liquidity-driven moves.
Liquidation corridors and short-term price scenarios
Liquidation corridors are price ranges where concentrated stop-losses and margin calls are likely to cascade. Define corridors relative to recent swing points rather than absolute prices — that makes the approach durable across market regimes.
Scenario framework (illustrative, not predictive):
ETF-driven steady uptrend (low-leverage regime). ETF inflows continue, OI growth stalls or rises slowly, funding remains moderate. Price march higher with controlled pullbacks; liquidation risk limited to isolated leverage errors.
Leverage-amplified rally (current mixed regime). Rising OI and positive funding with heavy ETF demand. Short squeezes can push price above technical resistance, but whipsaws increase. Liquidation corridor on the downside is usually located ~5–12% below short-term swing lows because many margin stops cluster around recent lows and moving averages.
Forced deleveraging (cascade). A catalyst (macro risk, bad ETH-specific news, ETF flow slowdown) hits; funding collapses and OI drops rapidly as longs liquidate. In this regime, liquidation corridors can extend 15–30% from the peak as successive margin calls and stop levels are eaten.
How to locate corridors practically: map cluster levels where on-chain/centralized orderbook liquidity thins (e.g., large gaps in limit-book depth), align them with net open interest levels (the dollar value of open positions) and identify where funding rates reverse. Those combined levels form likely corridors where liquidations concentrate.
Margin dynamics: cross vs isolated, sizing, and hedges
Margin configuration materially affects a trader’s vulnerability:
Isolated margin caps the loss to the position size; it's generally safer for leveraged traders who want to limit spillover. Use isolated when you want a clean failure point.
Cross margin shares collateral across positions; it can prevent immediate liquidation but risks a larger account wipe in a fast move. Use cross when you have diversified offsets or when you rely on a broad portfolio buffer.
Position-sizing rules under active leverage risk:
Keep leveraged exposure small relative to account NAV when OI and funding are both elevated. A rule-of-thumb: reduce gross leveraged exposure by 20–40% vs. neutral-volatility sizing when funding > 0.05% per 8h and OI growth > 10% week-on-week.
Use staggered entry and scaled stops to avoid single-level waterfall liquidations. Break larger positions into tranches with liquidity-aware stop placement.
Hedging options and alternatives:
Buy protective puts or use short-dated options to cap downside in high-leverage regimes; delta-hedged structures can limit cost while protecting from tail moves.
Consider futures hedges on venues with deep liquidity rather than trying to exit large spot positions into thin orderbooks.
For retail or non-levered exposure, spot installment products or ETFs (such as ETHA) offer a way to gain exposure without exchange margin risk — platforms like Bitlet.app illustrate alternative access models to spot exposure without direct leverage.
Practical trade checklist for the next 7–14 days
A compact checklist to operationalize the signals discussed:
- Monitor Binance futures OI and the week-on-week change; treat >10–15% weekly OI growth as elevated.
- Watch funding rates: funding >0.03–0.05% per 8-hour window increases short-term blow-up risk for longs.
- Track ETF daily creations and net inflows (ETHA and peers) — if ETF flows slow materially, risk appetite can evaporate fast.
- Observe exchange ETH balances: sudden inflows back to exchanges are a red flag for near-term selling pressure.
- Use layered stops and isolate margin for new leveraged entries; pre-size hedges with options or opposing futures.
- Avoid one-way size concentration: if your book is heavy net-long with concentrated margin, trim into strength and hedge selectively.
- Keep cash/stablecoin dry powder to rebuy after liquidations rather than trying to time bottoms with naked leveraged longs.
What to expect next and concluding guidance
The coexistence of record-like ETF demand and a return of leveraged speculative flows creates higher baseline volatility for ETH. That volatility can be constructive for active traders — it creates tradeable ranges and setups — but it also increases tail risk for undercapitalized leveraged players.
For risk managers, the imperative is simple: measure leverage, not just flow. Open interest, funding rates, and exchange balances together form a real-time risk dashboard. ETF flows provide a safety net that can support higher fair value for ETH, but they do not eliminate the possibility of violent, short-term liquidations driven by concentrated futures positions.
If you trade in this environment, err on the side of smaller leverage, explicit hedges, and discipline around margin mode. For portfolio allocations, consider adding spot or ETF exposure to reduce pure leverage dependency. And always watch the market microstructure signals — they will tell you when a benign pullback is likely vs. when a cascade is brewing.
For many traders, macro cues still come through Bitcoin moves, and DeFi liquidity shifts can change how leverage unwinds across spot and derivatives (see DeFi). Keep those cross-market linkages in your monitoring routine.
Sources
- Binance reports major Ethereum leverage spike as trading volume soars: https://thecurrencyanalytics.com/altcoins/binance-reports-major-ethereum-leverage-spike-as-trading-volume-soars-247843
- Spot Ethereum ETF inflows and BlackRock ETHA reporting: https://crypto.news/ethereum-etfs-hit-three-week-high-inflows-will-eth-price-break-2400/
- Price performance and breakout hopes: https://beincrypto.com/ethereum-price-25-percent-breakout-hopes/
- Consolidated reporting on Binance leverage return: https://www.cointribune.com/en/binance-data-shows-leverage-return-boosting-ethereum/?utm_source=snapi