XRP’s Quiet Reset: Ascending Triangle, Price Scenarios, and Trade Plans for Swing Traders
Summary
Executive summary: what’s happening with XRP now
Over the past weeks XRP has been drifting into a range-bound structure that technical analysts are calling an ascending triangle, with a clear support band roughly between $0.60 and $0.90. That structure concentrates decision points: either a breakout that targets a higher measured move, or a breakdown that could revisit lower targets near the $0.30 area that some bearish models propose.
This article connects the technical pattern, headline price predictions, on‑chain liquidity signals, and Ripple’s momentum (including CEO Brad Garlinghouse’s public optimism and hackathon developments) into actionable scenarios and trade setups for swing traders and medium‑term investors.
The technical picture: ascending triangle and support zone
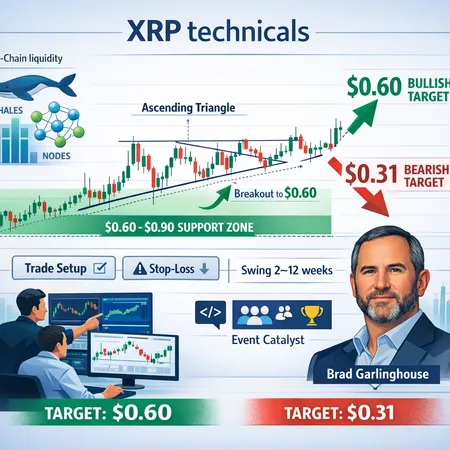
Technical commentators have highlighted a support band between $0.60 and $0.90 that’s functionally acting as the triangle base and lower trend touches. As noted in recent analysis, that band has repeatedly attracted bids and defined the triangle’s base while higher lows compress price into an apex.
An ascending triangle is typically a continuation or accumulation pattern: buyers step in at higher lows while sellers defend a roughly horizontal resistance. If buyers overcome overhead supply with a daily close above the horizontal resistance (near the $0.90 level in many reads), the pattern often projects a measured move equal to the triangle’s height.
Using the observable band between $0.60 (base) and $0.90 (resistance), the triangle height is about $0.30. A clean breakout above $0.90 therefore implies a first technical target near $1.20 (0.90 + 0.30). Conversely, a decisive breakdown under $0.60 could project a move toward ~$0.30, which aligns with the lower‑case scenarios circulated in market commentary.
For traders who want a second reference, technical notes frequently cite the $0.60–$0.90 support area directly as the key risk zone — see the analyst breakdown on the triangle and support range for a concise technical read. (Analyst piece: NewsBTC).
Headline predictions and contrasting scenarios (0.31 vs 0.60)
Market coverage has been split between bullish and bearish headline numbers. Some outlets and models produce downside scenarios near $0.31, while a conservative bullish base case keeps $0.60 as a structural floor for higher‑probability accumulation.
How to reconcile these figures:
- Bear case (0.31): a failure to hold the $0.60 level on heavy volume and a cascade of stops would unwind the triangle and drive a measured move roughly equal to the triangle height below the base (which mathematically lands near $0.30). Coverage that models shock‑lower outcomes summarizes the same technical mechanics that lead to deep retests (CryptoPotato).
- Base/bull case (≥0.60): if the $0.60–$0.90 area continues to absorb selling and on‑chain liquidity supports bids, the more likely path — absent macro shocks — is consolidation and eventual breakout. This is the narrative some market analysts describe as a quiet reset behind the scenes (Coinpaper).
Both scenarios are valid; the key is defining entry triggers and stop rules tied to the triangle boundaries and on‑chain confirmation rather than guessing where sentiment will flip.
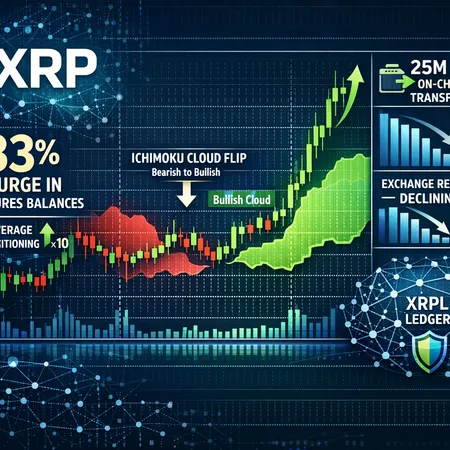
On‑chain liquidity and metrics: reset or transient retracement?
Distinguishing a genuine market reset from a transient retracement comes down to liquidity dynamics and flow data. Traders should watch several on‑chain and exchange metrics:
- Exchange reserves: sustained declines in exchange XRP balances suggest supply is being taken off markets, supporting the reset narrative; increasing reserves indicate potential selling pressure. Coinpaper’s recent take argues the market is quietly resetting while liquidity shifts happen behind the scenes (Coinpaper).
- Large transfers and whale behavior: clustering of large inbound transfers to exchanges often precedes selloffs. Conversely, large outbound flows to cold storage or DeFi bridges can indicate accumulation.
- Order‑book depth and spreads: a shallow book with wide spreads near the triangle base increases vulnerability to quick breakdowns; thicker bids near $0.60–$0.80 provide a cushion.
- Volume profiles on breakout attempts: a breakout with expanding volume (and higher on‑chain activity such as new active addresses) validates the move. A breakout on thin volume risks a false signal.
Taken together, these data points can validate whether price action is a methodical reset or a transient retracement. For traders without deep on‑chain tooling, watching exchange reserve reports and high‑timeframe volume alongside price structure is a practical compromise.
Ripple CEO optimism and ecosystem catalysts
Fundamental catalysts will matter for any multi‑week or multi‑month thesis. Ripple CEO Brad Garlinghouse has publicly expressed optimism for 2026 and highlighted ecosystem activity such as hackathons that can drive developer momentum and narrative shifts (U.Today).
Practical implications:
- Developer activity and hackathons can accelerate integrations (custody, on‑ramps, DeFi rails) that increase utility and liquidity demand. Coverage of the XRP reset narrative often pairs these fundamental developments with technical consolidation (Coinpaper).
- Positive executive messaging can shift sentiment, but it’s most useful when paired with measurable adoption metrics (new on‑chain flows, exchange listings, stablecoin corridors) rather than being viewed as price‑moving on its own.
Use executive optimism as a catalyst checklist — not as your sole trade trigger.
Trade setups, risk controls, and timeframes for swing traders
Below are practical, concrete frameworks rooted in the technical structure and the liquidity picture.
- Conservative long (trend confirmation)
- Entry: buy on a confirmed daily close above ~$0.90 with above‑average volume and a retest that holds. Volume confirmation minimizes false breakouts.
- Target: initial measured target ~$1.20; consider partial profit-taking and trailing stops for gains beyond that level.
- Stop: below the breakout retest or an ATR (14)‑based buffer — e.g., a 1.5–2x ATR below the retest price.
- Timeframe: 4–12 weeks.
- Aggressive long (early accumulation)
- Entry: buy inside the triangle on pullbacks to the ascending trendline or nearer the $0.60–$0.75 band, provided on‑chain liquidity (exchange reserves stable or declining) supports accumulation.
- Target: $1.20 initial; scale out into resistance clusters.
- Stop: below $0.60 (triangle base); size position so the stop equates to a manageable capital loss (e.g., 1–3% of portfolio).
- Timeframe: 6–16 weeks (higher risk, more time for thesis to play out).
- Short / hedge (breakdown scenario)
- Entry: on a daily close beneath $0.60 with rising volume and exchange inflows; consider options if available to limit margin risks.
- Target: measured move near $0.30 as a first objective; use layered exits.
- Stop: conservative stop above $0.60 or the most recent failed retest level.
- Timeframe: 2–10 weeks.
Risk management rules for all setups
- Position sizing: risk per trade should be defined in fiat terms (e.g., risking 1% of account equity per trade). Adjust size based on stop distance.
- Use ATR to size stops emotionally and mechanically (ATR captures current volatility).
- Avoid averaging down blindly: if price violates the structural base ($0.60) with confirming flow data, reassess thesis rather than dollar‑cost averaging into a failing pattern.
Putting it together: watchlist and event calendar
Key things to watch in the coming weeks:
- Price action around $0.60–$0.90: daily closes and volume spikes.
- Exchange reserves and large transfer flow reports.
- Developer and adoption headlines (hackathons, integrations) and any major legal or regulatory announcements. U.Today covered Brad Garlinghouse’s optimism tied to ecosystem events — those events can act as catalysts if adoption metrics follow (U.Today).
- Macro risk: broader crypto and risk‑on/off moves (for many traders, Bitcoin remains the primary market bellwether) and capital flows into risk assets.
Also consider cross‑market liquidity in DeFi corridors and stablecoin pairings that can either amplify or dampen XRP’s moves.
Final thoughts: scenario planning, not certainty
XRP’s current structure offers tidy, high‑signal decision points. The ascending triangle gives measurable upside and downside targets: ~$1.20 on a confirmed breakout and ~$0.30 on a confirmed breakdown — both rooted in the same pattern math. On‑chain liquidity and order‑book depth will determine whether the market is simply retracing or undergoing a real reset.
Use executive optimism (Brad Garlinghouse and developer activity) as supportive context, not the trigger for buying at will. Combine technical triggers, volume and on‑chain validation, and disciplined stops. For traders using platforms like Bitlet.app, these scenario plans and risk frameworks can be implemented with clear entry and exit rules to manage swing exposures.
Sources
- Coinpaper — XRP quietly resets analysis: https://coinpaper.com/14986/xrp-quietly-resets-while-stealing-the-spotlight-behind-the-scenes?utm_source=snapi
- NewsBTC — Triangle support between $0.60 and $0.90: https://www.newsbtc.com/xrp-news/xrp-triangle-support-between-0-60-and-0-90/
- CryptoPotato — Contrasting Ripple price predictions (0.60 vs 0.31): https://cryptopotato.com/shocking-ripple-price-predictions-0-60-or-31-next-for-xrp/
- U.Today — Brad Garlinghouse optimism and hackathon coverage: https://u.today/ripple-ceo-on-crypto-i-have-so-much-optimism-for-2026?utm_source=snapi