Bitcoin: True Capitulation or Just a Leveraged Washout? An Evidence-Based Guide
Summary
Intro: why this moment matters
A big red candle catches attention; sustained capitulation changes narratives. Over recent sessions, Bitcoin (BTC) briefly slid below $63k, prompting headlines that $150 billion had been erased from crypto markets and claims the market may be in full capitulation. For many traders, Bitcoin remains the primary market bellwether — so the distinction between capitulation and a leveraged washout matters for position sizing, hedging and where to allocate capital.
Understanding the difference is not academic: capitulation implies broad, behavior-driven selling and durable risk-off, while a leveraged washout implies a mechanical flush of overstretched positions that can create attractive re-entry points. Below I lay out the indicators on both sides, cite recent reporting and on-chain signals, and conclude with tactical guidance for different investor profiles.
Capitulation vs. leveraged washout — a quick framework
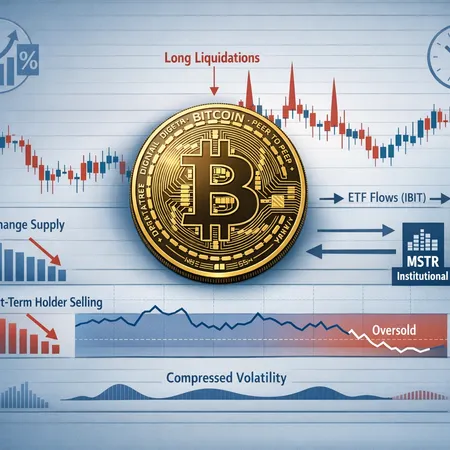
Capitulation typically includes sustained panic selling by retail and some institutions, a collapse in on-chain demand, and new lows in key momentum metrics like the Relative Strength Index (RSI). In contrast, a leveraged washout is more mechanical: forced liquidations, margin calls and exchange-induced selling that may violently accelerate a dip but does not necessarily indicate a durable shift in longer-term demand.
Think of capitulation as a psychology reset — buyers disappear and sellers lock in losses. A washout is a plumbing problem: leverage gets flushed and liquidity providers step in. The trade implications differ: capitulation argues for caution and hedging; a washout can offer buying opportunities for those who wait through the short-term volatility.
Indicators pointing toward capitulation
RSI and momentum exhaustion
The RSI is a short-term momentum gauge that measures the speed and change of price moves. Readings near or below historic lows are classic signs of capitulation because they show persistent selling pressure and waning buyer participation. Recent analyses flagged RSI moving toward record low territory during the sell-off, which traders interpreted as a sign of panic momentum rather than orderly profit-taking (see reporting that notes panic selling and low RSI values).
Exchange supply and withdrawal behavior
A declining exchange supply — fewer BTC on centralized exchanges — can be ambiguous. When investors withdraw to cold storage it’s bullish; when exchange balances fall because leveraged positions are being forcibly settled, it’s a sign of forced deleveraging. Recent price slides were accompanied by rapid exchange balance shifts and liquidation events that magnified the move.
Long liquidations and margin stress
Large-scale long liquidations are the mechanical engine behind many sharp drawdowns. Media reports quantified hundreds of millions in long liquidations as BTC dropped under $63k, a clear signal that leverage was aggressively unwinding. When long liquidations cluster, stop-loss cascades and algorithmic selling can push prices lower than fundamentals alone would justify, creating the feel of a capitulation even if the core holder base remains intact.
Short-term holder behavior
On-chain flows from short-term holders (STHs) — wallets that have held BTC for weeks or months — provide a behavioral barometer. Rising STH sell pressure alongside falling prices is textbook capitulation. If STH balances are being transferred to exchanges and traded at these levels, that suggests some buyers are indeed capitulating rather than simply trimming leveraged positions.
Indicators suggesting a leveraged washout or maturing market
Leverage flush dynamics and analyst counterpoints
Some analysts frame the move beneath $63k not as terminal capitulation but as a leverage flush. That interpretation points to concentrated derivatives activity and margin mechanics rather than fresh, broad-based selling. In other words, the plumbing of futures and perpetual markets can create outsized moves that aren't matched by proportionate spot-demand destruction.
Compressed volatility and institutional plumbing
A modern difference versus past cycles is the growth of ETF and institutional liquidity. Spot ETF vehicles and large holders (for example IBIT listings and institutional treasury plays like MSTR) provide deeper, steadier demand which can blunt the downside and shorten panic cycles. ETF flows can also create asymmetric liquidity: large inflows smooth downside, but fast outflows can temporarily exacerbate moves. The increasing presence of these vehicles is one reason some commentators argue the 2025–26 bear could be milder than prior cycles.
Macro context and differentiated market structure
Macro has amplified crypto moves recently, but the crypto market no longer reacts in isolation. Cross-asset dynamics, rising OTC desks, and improved custody mean forced selling may be absorbed more quickly by institutional counterparties. That doesn’t eliminate spikes, but it changes their duration and typical recovery path compared with 2018–2019 or early 2020.
Putting the signals together: which interpretation fits best?
There is no single-locus answer. The evidence points to both: large long liquidations and low RSI indicate immediate panic and mechanical deleveraging; at the same time, the presence of ETF liquidity, institutional buyers and arguments from some analysts that this is a leverage purge rather than a structural capitulation temper the claim that markets have irrevocably shifted sentiment.
Recent reporting documented the $150B market drawdown as BTC dipped and flagged large-scale liquidations during the episode. Other coverage emphasized panic-like behavior with RSI readings near historic lows. Yet independent notes that frame the move as a leverage flush and pieces arguing that future bear dynamics could be milder provide counterbalance. In short: this looks like a heavy washout built on a foundation of forced liquidations and nervous market psychology — a hybrid picture where mechanical leverage drove a panic-like capitulation in the short term, but deeper, durable capitulation across all holder classes is not yet conclusively proven.
Tactical guidance by investor type
Below are practical actions tied to risk tolerance and time horizon. These are not financial advice but a tactical framework to help you translate the on-chain and market signals into position decisions.
For HODLers (long-term holders)
- Stay strategic: if your thesis is multi-year adoption and scarcity, a leveraged washout can be a buying opportunity. Dollar-cost averaging (DCA) into weakness reduces timing risk.
- Size with conviction: consider deploying incremental buys rather than large lump sums — that mitigates the risk of further bleed from extended capitulation.
- Keep dry powder and custody hygiene: use cold storage for long-term holdings and avoid rehypothecation on exchanges; Bitlet.app can be part of a broader execution strategy.
For swing traders
- Trade structure: favor range and mean-reversion strategies if you expect a levered spark will cause volatile bounces and retests. Short squeezes and snap recoveries are common after heavy long liquidations.
- Use momentum and RSI as filters: extremely low RSI readings can signal oversold bounces, but confirm with volume and liquidation heatmaps. Avoid chasing a bounce without clear follow-through.
- Manage risk actively: tighten stop-losses on leveraged positions and consider options collars (buy put / sell call) to hedge directional risk during suspected capitulation periods.
For institutions and allocators
- Assess liquidity costs: ETF vehicles like IBIT and liquid stocks such as MSTR provide exposure but also introduce basis and tracking considerations. Large rebalances can move markets—plan execution across OTC desks and staggered fills.
- Hedging and programmatic responses: use block trades, options and futures to hedge short-term drawdowns rather than forced spot selling. Maintain counterparty diversity.
- Stress-test scenarios: simulate both a short-lived leverage flush and a longer capitulation with reduced inflows to understand funding and liquidity runway.
Risk management playbook
- Correlate signals: a single metric (low RSI or a single liquidation event) shouldn’t trigger full portfolio shifts. Look for clusters: liquidations + STH selling + falling exchange balances = higher capitulation risk.
- Size by conviction: increase exposure slowly when the market shows signs of stabilization (shrinking liquidation clusters, falling realized volatility, steady ETF inflows).
- Use asymmetric instruments: options allow limited downside for leveraged upside; collars and verticals can protect capital without abandoning participation entirely.
Final synthesis
Right now the most defensible reading is a hybrid: heavy forced liquidations and momentum exhaustion created a short-term capitulation-like episode, but structural improvements — deeper ETF liquidity, institutional participation and compressed macro-driven volatility — argue that a full, behavior-driven capitulation across all holder types has not been definitively proven. Traders should treat the immediate environment as elevated risk with opportunity: reactive signals (RSI, long liquidations, exchange flows) matter, but so does context (ETF flows, institutional plumbing).
If you’re a HODLer, consider phased buying and custody discipline. If you’re a swing trader, expect violent intraday moves and use tight risk controls. Institutions should lean into execution planning and hedging rather than ad hoc spot selling.
Sources
- Reports of a broad market drawdown and $150B wiped from crypto as BTC dips below $63k
- Analysis suggesting BTC may be in full capitulation with panic selling and RSI near record lows
- Report on large long liquidations wiping out hundreds of millions as BTC slides under $63k
- Analyst note framing the move as a leverage flush rather than total capitulation
- Piece arguing Bitcoin's 2025–2026 bear could be the mildest ever — evidence of market maturity