Whale Alert: Interpreting the 370B SHIB Transfer — Risk Playbook for Meme‑Coin Traders
Summary
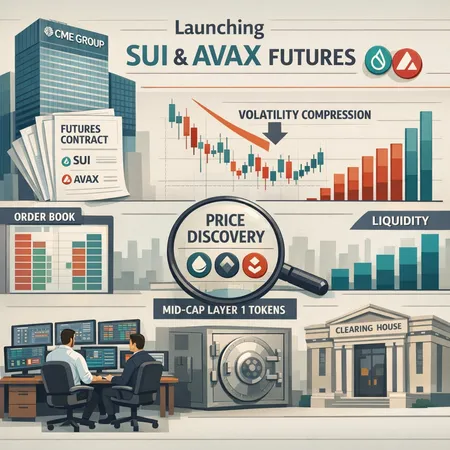
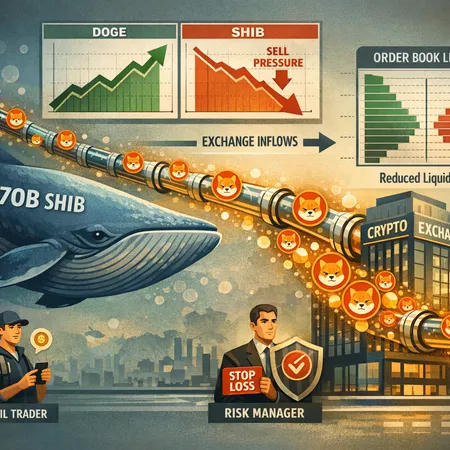
The trigger: 370 billion SHIB lands on an exchange — why traders care
A single on‑chain event can reframe a whole narrative: a whale moved 370 billion SHIB to a centralized exchange, an action reported by crypto news trackers that immediately raised alarm bells about potential sell pressure. While the raw number sounds huge, the meaningful question for traders is how much of the available exchange float that transfer represents — because even a fraction of circulating supply becoming available to sell can blow through thin order books and spike slippage.
This episode is a reminder that simple metrics (transfer size alone) don’t tell the whole story. You need to combine on‑chain context with exchange order‑book health, funding rates, and market structure across similar assets to form a view that’s actionable rather than sensational. For many traders, looking at exchange inflows alongside liquidity metrics gives the fastest read on near‑term downside risk.
Why exchange inflows matter more than headline supply figures
An exchange inflow is a liquidity‑conversion event: a token moves from cold wallet or private custody into an environment where it can be sold with relative ease. That matters for two reasons. First, only a small portion of a token’s total supply is typically available on exchanges at any time — the exchange float is what actually matters for price impact. Second, order‑book depth on most exchanges is shallow for meme coins; a single large sell order can cascade through multiple price levels.
Exchange inflows also change the market microstructure: bid‑ask spreads widen, limit orders are picked off, and market makers may pull quotes if they anticipate adverse selection. Monitoring inflow spikes together with on‑exchange stablecoin balances gives you a read on the counterparty capacity to buy the incoming supply. If stablecoin balances are low while inflows spike, the net effect almost always tilts toward downward price pressure. If you track DeFi liquidity pools as well, you'll see a related effect: DEX slippage and pool ratios adjust quickly when large amounts hit CEX order books, so consider DeFi metrics alongside exchange flows.
On‑chain signals that typically precede dumps
Below are the most reliable on‑chain and market signals experienced traders use to anticipate a potential dump. Treat them as a checklist rather than a single trigger — multiple signals in concert raise the probability of a downside event.
Exchange inflow spikes — Sudden transfers to CEX addresses, especially from wallets known to hold large concentrated positions, are the clearest immediate red flag. The recent 370B SHIB movement attracted attention for this reason reported here.
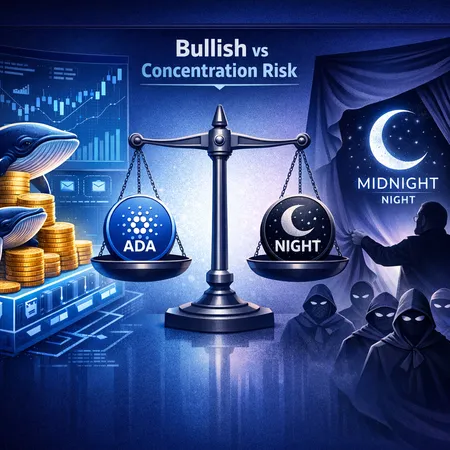
Concentration shifts — When top‑holder balances increase or large wallets start consolidating, liquidity risk increases because selling pressure becomes more correlated and concentrated.
Token age consumed / dormancy change — Old tokens moving after long dormancy can signal profit taking. A spike in spent outputs from long‑held addresses often precedes distribution phases.
DEX swap imbalances and rising slippage — On‑chain swap volumes moving disproportionately to sell side on DEXs indicate distribution pressure before it shows up in CEX order books.
Funding rates and open interest skew — For meme assets with derivatives (or when BTC derivatives skew), rising negative funding or explosive open interest growth can precede forced liquidations and cascade selling.
Social and on‑chain sentiment divergence — An uptick in negative sentiment or sudden drop in social engagement while whale activity increases can be a compound signal.
No single metric is dispositive, but a cluster of these signals in a short window significantly raises downside odds.
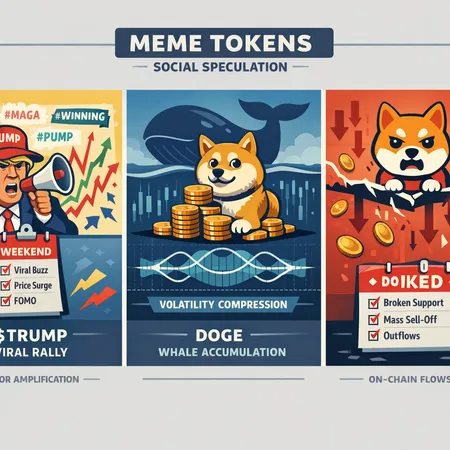
DOGE vs SHIB: how market structure has diverged this cycle
Dogecoin and Shiba Inu are often lumped together as “memes,” but their market structures have diverged in ways that matter for risk management. DOGE benefits from a relatively long history of exchange listings, a larger and deeper order‑book presence on major venues, and broader derivatives interest — traits that usually translate to better immediate liquidity. Technical analysis writers have flagged clear resistance levels for DOGE (for example, commentary around the 0.105 level highlights where sellers may reassert control)see analysis.
SHIB, by contrast, began life with a massive initial supply and continues to have a complex distribution profile: big wallets (whales) still hold meaningful, concentrated balances, and a substantial portion of supply isn't actively traded on exchange order books. This makes price action more sensitive to discrete whale events — like the 370B transfer — because available exchange depth can be far smaller than headline supply percentages imply. A recent comparative piece also highlights how investor expectations and utility narratives between DOGE and SHIB have started to split, which affects liquidity demand and resilience during stress read more.
In short: DOGE often absorbs larger flows with less slippage; SHIB can show violent microstructure moves when concentrated holders shift supply onto exchanges.
Interpreting the 370B SHIB transfer: scenarios and probabilities
Context matters. 370 billion SHIB is a headline number, but as a percent of total historical supply it’s small — yet the key is percentage of exchange float. If that transfer represents a meaningful portion of what’s actually tradeable on exchanges, the probability of price impact rises sharply.
Possible scenarios:
- Sell‑off: Whale lists or sells into the order book, eating bids and creating cascading volatility.
- Staging/OTC trade: The whale moves assets to an exchange but executes OTC or off‑book sales to avoid public slippage (less immediate market impact, but liquidity is still being redistributed).
- Position reshuffle: The transfer is a repositioning (e.g., preparing for a structured sell or margin/derivative use) and may not hit the spot market right away.
Watch for quick confirming signals: rapid growth in exchange order cancellations, widening bid‑ask spreads, falling stablecoin reserves, and jumps in sell‑side DEX swap volumes. The initial report is a red flag — not a certainty — but it should move the event into a higher‑priority monitoring state for any SHIB holder or trader.
Tactical playbook: how holders and traders should respond
Below is a practical checklist you can apply immediately if you hold SHIB, DOGE, or correlated meme assets. These steps balance protection with the need to avoid being picked off by reflexive selling.
Assess exposure and set size rules — If a single whale event raises the probability of >10–15% intraday moves, cap meme exposure to a percentage of portfolio risk that you can tolerate (e.g., 1–3% of total capital for conservative retail; higher for aggressive traders).
Check order‑book depth and exchange float — Before executing, eyeball the top 10–20 price levels on major exchanges and compare against the amount you’d need to liquidate. If slippage would wipe out gains, consider scaling out.
Use execution tools (limit, TWAP, iceberg) — Avoid large market sells into thin books. Use TWAP or split limit orders to reduce market impact. For urgent exits, prefer a staged limit ladder over a single market order.
Hedge selectively — Short correlated instruments or use inverse positions (on margin or perpetuals) to offset immediate downside risk. If options are available, buy protective puts sized to your exposure.
Set dynamic stops and exit rules — Use mental and mechanical stop levels based on liquidity bands (not just price). For example, set stops beyond obvious support bands but tighten them if exchange inflows accelerate.
Monitor funding and derivatives risk — High open interest plus negative funding can produce liquidations that amplify dumps. Reduce leveraged exposure first.
Keep stablecoin or base‑asset liquidity ready — If your goal is to re‑enter after a flush, having dry powder reduces the need to chase prices. Platforms like Bitlet.app can be part of a broader toolkit for managing executions and settlements.
Institutionalize alerts — For risk managers, set automated alerts for: 1) top‑wallet transfers to known exchange addresses; 2) exchange inflow spikes above a rolling threshold; 3) sharp declines in stablecoin reserves on major exchanges.
Example scenarios and response templates
Scenario A — Whale inflow + rising sell volumes: tighten stops to guard gains, convert a portion to stablecoins with staggered limit sells, and open a small short or inverse position to offset tail risk.
Scenario B — Whale inflow but order books remain deep and stable: monitor but avoid knee‑jerk selling; consider trimming positions selectively rather than exiting entirely, and place limit sells around liquid price levels.
Scenario C — Multiple whales moving supply to exchanges across wallets: assume coordinated distribution risk; prioritize capital preservation — scale out more aggressively and increase hedges.
Each response balances execution risk (slippage) with market risk (price moves). The aim is to avoid being the last liquidity provider in a fast dump.
Monitoring checklist: metrics, thresholds, and tools
Keep this short checklist pinned during periods of heightened whale activity:
- Exchange inflow volume (24h spike relative to 7d average)
- Exchange float % of circulating supply (and change over time)
- Top‑10 wallet supply concentration and recent transfers
- Order‑book depth for top exchanges (bids within 1–5% bands)
- Stablecoin balances on major exchanges
- DEX slippage and pool imbalances
- Funding rates and open interest on derivatives
- Social volume and sentiment changes
Tools to watch: on‑chain explorers, chain analytics platforms, exchange order‑book screens, and derivative dashboards. Where appropriate, compare meme‑coin signals with broader market bellwethers like Bitcoin to differentiate idiosyncratic risk from market‑wide liquidations.
Final thoughts
Whale transfers will always trigger headlines; the real skill for traders and risk managers is separating noise from actionable risk. The 370B SHIB transfer is a signal worth respecting because of how concentrated SHIB’s tradable supply can be. Combine exchange inflows with order‑book analysis, derivatives positioning, and DEX behavior to form a multi‑dimensional view — then execute with liquidity‑aware tactics.
If you follow a consistent checklist and keep execution discipline (limit/TWAP, conservative sizing, selective hedging), you’ll avoid many of the common traps that turn a single whale move into a portfolio disaster.