Cardano Whales Accumulate 819M ADA — What the Top‑10 Re‑Entry Means for Investors
Summary
Executive snapshot
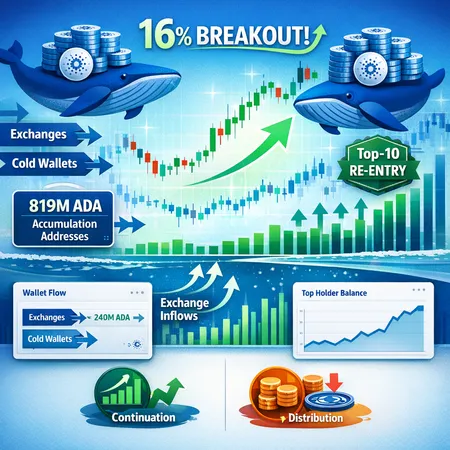
On‑chain reporters flagged that Cardano "sharks" and whales quietly picked up roughly 819 million ADA during the drawdown, a substantial nominate accumulation that preceded a ~16% technical breakout and re‑entry into the top 10 by market cap. Coverage from multiple outlets corroborates the flow and the rally: the accumulation window is documented in on‑chain writeups and the price impulse has been covered as a classic breakout move. For long‑term investors and on‑chain analysts, the key question is not only that large players bought, but what they bought into — and what their behavior implies for liquidity, price structure, and your portfolio sizing.
In this piece I combine the on‑chain accumulation metrics with technical context, explain why concentrated buying by whales matters, list the tools and signals to watch, and outline practical scenarios and sizing guidance for adding ADA exposure after the rally.
What the on‑chain evidence shows
Multiple on‑chain reports documenting large inbound flows to non‑exchange addresses and balance changes show a material accumulation event. Analysts tracked roughly 819M ADA moving into wallets attributed to sharks and whales during the pullback, a point reflected in coverage by Crypto.News and NewsBTC that catalog the uptick in large‑holder share of supply (crypto.news, newsbtc).
Coinpedia subsequently noted a 16% intraday rally that pushed Cardano back into the top‑10 list by market cap, a price reaction that coincided with the accumulation window (coinpedia). Taken together, the narrative is straightforward: large holders materially increased positions during lower prices, then the market experienced a technical breakout as liquidity shrank and buy pressure rose.
Why whale accumulation matters for medium‑term price structure
Large‑holder accumulation changes the distribution of available supply. When a meaningful chunk of circulating ADA migrates to cold or non‑exchange custody, two things tend to happen:
- Available float shrinks: less sellable supply on exchange order books increases the chance of sharper rallies on follow‑through demand.
- Liquidity becomes stickier: whales often hold longer‑term, reducing short‑term sell pressure, which can steepen trend continuation.
That said, concentration also brings risk. If whales choose to realize gains, the market can experience sudden, high‑volume sell events that cascade through thin order books. The medium‑term price structure therefore depends on whether accumulation is intentional accumulation for HODL or tactical positioning prior to distribution. The difference often shows in post‑breakout behavior: steady on‑chain outflows to cold wallets and declining exchange balances suggest buy‑and‑hold. Rapid transfers from cold wallets back to exchanges or clustering of large transfers near resistance levels point toward distribution.
The technical context behind the 16% breakout
The 16% move that propelled ADA into the top 10 followed a classic technical setup: a consolidation/trading range during the drawdown, lower highs on volume that masked accumulation, then a breakout above a short‑term resistance band with expanding volume. Technical breakouts are more reliable when supported by on‑chain cues — in this case, large address accumulation and falling exchange balances — because price is leaving fewer counterparties able or willing to sell at prior levels.
For traders, two structural checks matter: where the breakout sits relative to realized price bands (areas where existing holders bought) and whether market participation (futures open interest, options skew) confirms directional conviction. For long‑term investors the takeaway is different: a breakout backed by accumulation increases the odds that the rally is sustainable, but it doesn't eliminate downside risk from macro or market liquidity shocks.
Monitoring tools and metrics for whale flows
If you want to read the same tea leaves analysts are using, add the following tools to your workflow and set up alerts around these metrics:
- Glassnode / CryptoQuant / IntoTheBlock — exchange netflow (inflows vs outflows), realized price bands, and concentration statistics; watch for sustained exchange outflows after accumulation.
- Nansen — wallet labels and large‑transfer tracking; helps identify whether transfers go to cold wallets or exchange wallets.
- Whale Alert / Twitter monitoring — fast alerts for off‑exchange transfers and large bridge moves.
- Dune / custom dashboards — build queries to track cumulative ADA into top‑n addresses, average balance change of labeled whale addresses, and percent of supply in top‑100 wallets.
- Order book & liquidity metrics — monitor depth on Binance, OKX and major venues; thin depth near market price elevates volatility.
Concrete signals to watch: sustained exchange outflow after a rally (bullish), spikes in exchange inflows (warning), clustering of large transfers right before a resistance test (possible distribution), and increasing realized profits being taken by older cohorts (SOPR‑type signals adapted to ADA). Using Bitlet.app to automate installment purchases or to track recurring buys can also be practical for long‑term averaging without trying to time exact entry points.
Scenarios: continuation vs distribution (what to look for)
Scenario A — continuation (bull case):
- Exchange balances continue downward or stabilize at low levels.
- On‑chain labeled whale wallets show long‑term coins moving to cold storage.
- Breakout sees follow‑through with increased spot volume and rising open interest in derivatives markets.
- Price respects higher lows and reclaims short‑term moving averages.
Implication: probability of a sustained uptrend rises. Position sizing can be increased gradually on pullbacks to new support.
Scenario B — distribution (bear case):
- A cluster of large transfers moves from cold wallets to exchange addresses or OTC desks.
- Price spikes on low liquidity and then falls back quickly (bear trap).
- On‑chain realized profit metrics show older cohorts materializing gains en masse.
Implication: sell pressure could be concentrated and rapid; expect potential snapback corrections and wider intraday ranges. Consider protective sizing or hedges.
Scenario C — neutral consolidation:
- Accumulation is real but slow; price spends weeks forming a higher base with oscillating exchange flows.
Implication: best for patient investors to dollar‑cost average and monitor for breakout confirmation.
Practical portfolio sizing guidance after a rally
Long‑term investors often err by either chasing after breakouts or missing allocations due to fear of near‑term pullbacks. Here are pragmatic rules to size ADA exposure after a rally:
- Start with a baseline conviction allocation. If ADA is a core conviction (long‑term thesis on Cardano fundamentals and ecosystem), a typical range might be 1–5% of total liquid portfolio initially, adjusted for individual risk tolerance.
- Use staggered additions (DCA): if you want more exposure after the breakout, split buys across multiple days/weeks to avoid buying at a potential local top.
- Define a risk budget: limit any single crypto position to a size that a severe drawdown (50–80%) would not imperil your finances or cause panic selling.
- Protect with size‑adjusted hedges: if you hold a larger ADA allocation (>5–10% exposure), consider options or inverse products to hedge short‑term downside risk.
- Rebalance to thesis, not price: if you’re a long‑term investor, rebalance when ADA outperforms to a level beyond your target allocation rather than selling into every rally.
A conservative approach is to add small, staged positions when on‑chain signals confirm accumulation and exchange outflows; a more aggressive investor can add more quickly but should accept higher volatility.
A short checklist for on‑chain analysts deciding to add exposure
- Confirm persistent exchange outflows for at least several days after the breakout.
- Verify that labeled whale wallets are not simply rotating coins between hot and cold custody (i.e., check destination tags/addresses).
- Look for increasing on‑chain metrics tied to accumulation (percent supply in top addresses, declining fractional supply on exchanges).
- Combine on‑chain cues with price action: higher lows, expanding volume on up days, and retention above breakout level.
- Define entry plan and stop/hedge before committing capital.
Final thoughts — read accumulation with nuance
The 819M ADA accumulation and the 16% breakout are meaningful signals, but they are not guarantees. Large‑holder accumulation can fuel strong trends because it removes liquid supply and signals conviction; it can also presage distribution if the same holders decide to rotate profits. For long‑term investors the prudent route is to blend on‑chain evidence with order‑book liquidity checks and to scale positions using DCA and explicit risk budgets.
If you track these signals and tools closely — and combine them with clear position sizing and rebalancing rules — you can interpret whale accumulation as a useful input rather than a binary buy/sell trigger. For many, that means adding exposure selectively while keeping capital allocated to weather volatility.
Sources