Technicals
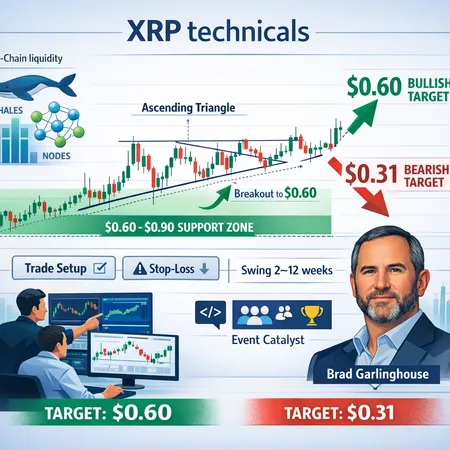
XRP appears to be consolidating inside an ascending triangle with defined support between $0.60–$0.90. This explainer combines technicals, on‑chain liquidity signals, executive optimism, and practical trade setups to map bullish and bearish scenarios for swing traders and medium‑term investors.

Bitcoin faces a crossroad: technicals and ETF outflows point to a deeper pullback toward $70k, while political risk around the Powell probe and renewed whale activity could push BTC past $90k. This article unpacks the evidence and gives traders actionable scenarios and entry/exit guardrails.
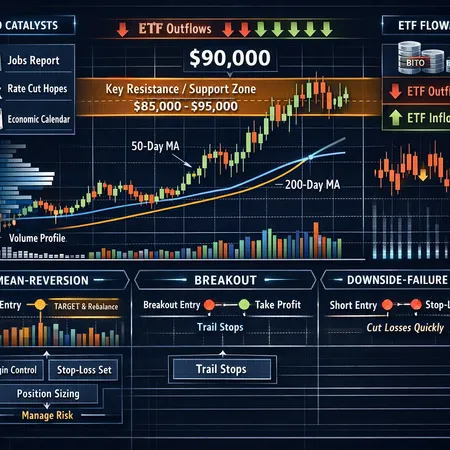
Bitcoin is trapped in a critical $85k–$95k band in early 2026, where technical structure, ETF flow dynamics and macro signals will dictate the next major leg. This piece synthesizes levels, orderflow implications of ETF outflows, macro drivers and actionable scenario-based trade plans for intermediate-to-advanced traders.

Dogecoin’s intraday moves are increasingly driven by derivatives flows and retail events rather than ETF bids. This feature explains how open-interest spikes, a lack of ETF demand, and retail promotions like the Robinhood giveaway create squeezes and what traders should watch to size event-driven DOGE trades responsibly.
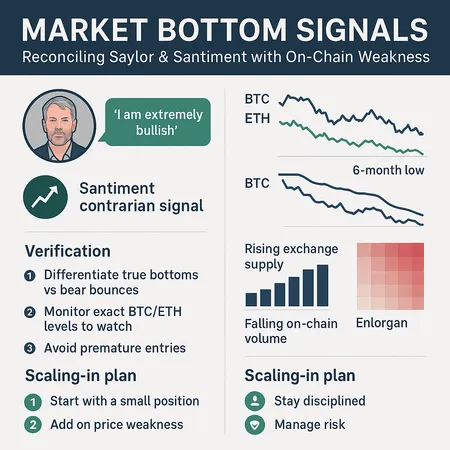
A practical, trader-focused framework to reconcile bullish commentary (Saylor, Santiment) with on-chain and technical warning signs (six‑month lows, death cross, rising exchange supply). Includes a checklist, exact BTC/ETH levels to watch, and a 4-step scaling‑in plan for managers with a long bias.
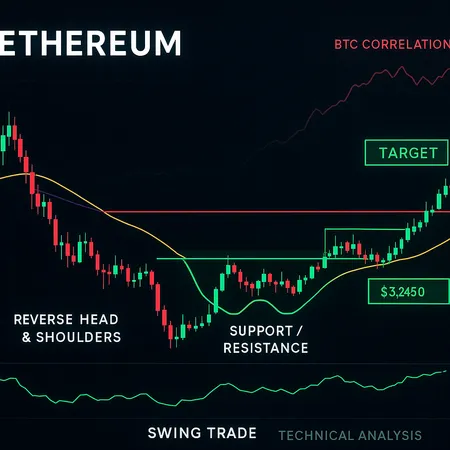
After a mid-November pullback and partial rebound around $3,230–$3,450, ETH is showing a short-term reversal setup that hinges on a few tactical zones. This piece breaks down the reversal pattern analysts flagged, key support/resistance, BTC correlation, and concrete swing-trade entry/stop/target plans with risk management.